Environmental Accounting for Pollution in the United States Economy
Nicholas Z. Muller, Robert Mendelsohn and William Nordhaus
Abstract: This study presents a framework to include environmental externalities into a system of national accounts. The paper estimates the air pollution damages for each industry in the United States. An integrated-assessment model quantifies the marginal damages of air pollution emissions for the US which are multiplied times the quantity of emissions by industry to compute gross damages. Solid waste combustion, sewage treatment, stone quarrying, marinas, and oil and coal-fired power plants have air pollution damages larger than their value added. The largest industrial contributor to external costs is coal-fired electric generation, whose damages range from 0.8 to 5.6 times value added.
11.29.2011
11.28.2011
Sense and Sustainability
I recently "discovered" a great podcast: Sense and Sustainability. Impressively, it's run by Jisung Park, a PhD student at Harvard econ, along with his colleagues (clearly none of them have reached the dissertation-writing-panic-stage of their respective programs). Check it out.

Sense and Sustainability is a production devoted to exploring the diversity of perspectives on issues of sustainable development. This semi-weekly podcast features guests from a range of disciplines, in an attempt to provide a more holistic sense of what we mean by ”sustainability”. We seek to provide a forum for educated yet accessible, incisive yet balanced conversations about a broad range of issues pertaining to global sustainable development.
You can download episodes from our website www.senseandsustainability.net, or subscribe to the podcast on iTunes (search: “Sense and Sustainability”).
Sense and Sustainability is a collaborative effort with Consilience: The Journal of Sustainable Development at Columbia University.
11.26.2011
Weekend Links
1) Madden Julian Conversation: A blog by a small group of climate scientists about the Madden-Julian Oscillation and the DYNAMO field campaign in the Indian Ocean.
2) trefis.com will do your stock price event studies for you. I wonder if "coups" or "corruption" ever show up as a line item.... (h/t Mina)

3) Earth | Time Lapse View from Space, Fly Over | NASA, ISS from Michael König (h/t Ram)
4) Teaching yourself to be a good seminar participant can have negative externalities.
5) NASA is looking for potential astronauts
11.24.2011
Math studying = f(weather)
At MIT we used to joke that the earth science department turned on the "weather machine" on the days when prospective students were visiting and trying to decide whether to enroll (since the weather always seemed to be perfect). But maybe the admissions department got a sign mixed up when then told EAPS what kind of weather they wanted.
More seriously, this may be important for explaining labor supply responses to the weather.
Weather to go to college
Uri Simonsohn
Abstract: Does current utility bias predictions of future utility for high stakes decisions? Here I provide field evidence consistent with such Projection Bias in one of life’s most thought-about decisions: college enrolment. After arguing and documenting with survey evidence that cloudiness increases the appeal of academic activities, I analyse the enrolment decisions of 1,284 prospective students who visited a university known for its academic strengths and recreational weaknesses. Consistent with the notion that current weather conditions influence decisions about future academic activities, I find that an increase in cloudcover of one standard deviation on the day of the visit is associated with an increase in the probability of enrolment of 9 percentage points.

11.23.2011
Assorted pre-Thanksgiving Links
1) Molecular genetics and economics (JEP, open access)
2) The case for a progressive tax (also JEP)
3) The power of austism
4) Every time I hear about football I think of this paper now
5) A nice guide to most mainstream panel data techniques, all on one page
6) The political economy of dissent in China is very unsettling
2) The case for a progressive tax (also JEP)
3) The power of austism
4) Every time I hear about football I think of this paper now
5) A nice guide to most mainstream panel data techniques, all on one page
6) The political economy of dissent in China is very unsettling
11.22.2011
Child labor and empirical development
Sol and I each recently come across empirical papers on child labor which, at least at first glance, seem to arrive at rather different conclusions. The first, by Eric Edmonds and Norbert Schady, finds that cash transfers to poor women in Ecuador decrease child labor rates (h/t Chris Blattman):
Poor women with children in Ecuador were selected at random for a cash transfer equivalent to 7 percent of monthly expenditures. The transfer is greater than the increase in schooling costs at the end of primary school, but it is less than 20 percent of median child labor earnings in the labor market. Poor families with children in school at the time of the award use the extra income to postpone the child’s entry into the labor force. Students in families induced to take-up the cash transfer by the experiment reduce their involvement in paid employment by 78 percent and unpaid economic activity inside their home by 32 percent.The second is by Leah Nelson and shows that medium term credit for poor Thai families increases child labor rates:
This paper seeks to understand household business decisions in response to increased credit access in an environment with multiple market failures. A simple model suggests that households at certain wealth thresholds might be able to overcome the fi xed costs of entering entrepreneurship when they have increased access to credit. In the presence of labor market imperfections however, these same households may also be more likely to employ child labor. I test these predictions using household and child level panel data from Thailand. To isolate the causal impacts of household borrowing, I exploit the exogenous timing and institutional features of the Million Baht Program, one of the largest government initiatives to increase household access to credit in the world. I find that, consistent with the model, expanded access to credit raises entry into entrepreneurship for households in specific wealth groups while simultaneously increasing the use of child labor in these households. The results suggest that through the avenue of encouraging entrepreneurial activity, expanding credit access may have unintended consequences for the supply of child labor.So at least according to these two studies there's a fairly substantial difference between simply providing money and providing credit that requires a productive return over a short horizon. That may seem obvious ex-post, but I think it'd be hard to predict without actually running the empirics and seeing how they shake out. Or, put differently: ever more and better empirical work provides ever better and more nuanced policy implications.
11.21.2011
Orbital forcing, the green Sahara, human migration and the rise of civilization in the Nile Valley
In a recent talk, Peter B. deMenocal was showing results from this 2006 paper in Science. If you're interested in this stuff, I also recommend looking at Peter's work. [More paleo-climate/social papers here.]
Climate-Controlled Holocene Occupation in the Sahara: Motor of Africa’s Evolution
Rudolph Kuper and Stefan Kropelin
Abstract: Radiocarbon data from 150 archaeological excavations in the now hyper-arid Eastern Sahara of Egypt, Sudan, Libya, and Chad reveal close links between climatic variations and prehistoric occupation during the past 12,000 years. Synoptic multiple-indicator views for major time slices demonstrate the transition from initial settlement after the sudden onset of humid conditions at 8500 B.C.E. to the exodus resulting from gradual desiccation since 5300 B.C.E. Southward shifting of the desert margin helped trigger the emergence of pharaonic civilization along the Nile, influenced the spread of pastoralism throughout the continent, and affects sub-Saharan Africa to the present day.

In some of my work with colleagues (notably Jesse), we've been finding evidence that it's very costly for populations to adapt to their climate, even in the long run (see here, here, here, and here). This implies that populations may will endure large welfare losses to the climate without employing adaptation (eg. migrating away). What I find interesting about the figure above is that even after an abrupt drying event, it takes populations ~1000 years to completely abandon a location. Presumably, over the course of that millenium, the abruptly dried climate exacted a substantial welfare toll on the population. I think this general idea has real implications for how we think about human responses to climatic changes. In general, it's assumed that adaptation is relatively cheap so that we adjust quickly to reduce welfare losses to the climate. However, if the costs of adaptation are high, the adjustments will be slow and the welfare losses will be large. (A more detailed discussion is in this paper.)
11.19.2011
Weekend links
Google Scholar Citations Open (h/t Jesse)
Adjusting HDI to account for sustainability (h/t Andy)
Quantified: a cool blog about data visualization (h/t Marshall)
IPCC Special Report: Managing the Risks of Extreme Events and Disasters to Advance Climate Change Adaptation (SREX)
Adjusting HDI to account for sustainability (h/t Andy)
Quantified: a cool blog about data visualization (h/t Marshall)
IPCC Special Report: Managing the Risks of Extreme Events and Disasters to Advance Climate Change Adaptation (SREX)
11.16.2011
We should rename this the Temperature Blog
When I first showed these results to people, more than one of my senior colleagues said "It can't be true, you made a mistake." But now that business faculty are working on the problem, I might be willing to declare that we have reached stage two of acceptance.
Severe Weather and Automobile Assembly Productivity
Gérard P. Cachon, Santiago Gallino and Marcelo Olivares
Abstract: It is expected that climate change could lead to an increased frequency of severe weather. In turn, severe weather intuitively should hamper the productivity of work that occurs outside. But what is the effect of rain, snow, fog, heat and wind on work that occurs indoors, such as the production of automobiles? Using weekly production data from 64 automobile plants in the United States over a ten-year period, we find that adverse weather conditions lead to a significant reduction in production. For example, one additional day of high wind advisory by the National Weather Service (i.e., maximum winds generally in excess of 44 miles per hour) reduces production by 26%, which is comparable in order of magnitude to the estimated productivity drop during the launch of a new vehicle. Furthermore, the location with the best weather (Arlington, Texas) only loses 2% of production per year due to the weather, whereas the location with the most adverse weather (Lordstown, OH) suffers an annual production loss of 11%. Our findings are useful both for assessing the potential aggregate productivity shock associated with inclement weather as well as guiding managers on where to locate a new production facility - in addition to the traditional factors considered in plant location (e.g., labor costs, local regulations, proximity to customers, access to suppliers), we add the prevalence of bad weather.
Welfare Costs of Long-Run Temperature Shifts
Ravi Bansal, Marcelo Ochoa
Abstract: This article makes a contribution towards understanding the impact of temperature fluctuations on the economy and financial markets. We present a long-run risks model with temperature related natural disasters. The model simultaneously matches observed temperature and consumption growth dynamics, and key features of financial markets data. We use this model to evaluate the role of temperature in determining asset prices, and to compute utility-based welfare costs as well as dollar costs of insuring against temperature fluctuations. We find that the temperature related utility-costs are about 0.78% of consumption, and the total dollar costs of completely insuring against temperature variation are 2.46% of world GDP. If we allow for temperature-triggered natural disasters to impact growth, insuring against temperature variation raise to 5.47% of world GDP. We show that the same features, long-run risks and recursive-preferences, that account for the risk-free rate and the equity premium puzzles also imply that temperature-related economic costs are important. Our model implies that a rise in global temperature lowers equity valuations and raises risk premiums.
Temperature, Aggregate Risk, and Expected Returns
Ravi Bansal, Marcelo Ochoa
Abstract: In this paper we show that temperature is an aggregate risk factor that adversely affects economic growth. Our argument is based on evidence from global capital markets which shows that the covariance between country equity returns and temperature (i.e., temperature betas) contains sharp information about the cross-country risk premium; countries closer to the Equator carry a positive temperature risk premium which decreases as one moves farther away from the Equator. The differences in temperature betas mirror exposures to aggregate growth rate risk, which we show is negatively impacted by temperature shocks. That is, portfolios with larger exposure to risk from aggregate growth also have larger temperature betas; hence, a larger risk premium. We further show that increases in global temperature have a negative impact on economic growth in countries closer to the Equator, while its impact is negligible in countries at high latitudes. Consistent with this evidence, we show that there is a parallel between a country's distance to the Equator and the economy's dependence on climate sensitive sectors; in countries closer to the Equator industries with a high exposure to temperature are more prevalent. We provide a Long-Run Risks based model that quantitatively accounts for cross-sectional differences in temperature betas, its link to expected returns, and the connection between aggregate growth and temperature risks.
More related material here.
11.14.2011
The Atlas of Economic Complexity

As readers will be well aware, the social accumulation of productive knowledge has not been universal: “The enormous income gaps between rich and poor nations are an expression of the vast differences in productive knowledge amassed by different nations.”
These differences are expressed in the diversity and sophistication of the things that each nation makes. In order to put knowledge into productive use, societies need to reassemble these distributed products through teams, organisations and markets. These issues are explored in detail in the Atlas, through the concept of the ‘product space’. This is a map which captures the products made by different countries in terms of their knowledge requirements
....
Hausmann, Hidalgo and their team have also developed an Index of Economic Complexity to represent their data systematically. This Index tells us about the richness of the product space of a given country, and by extension, is one useful indicator of the potential to grow.
In effect they're taking applied network techniques for measuring network density and size and using them to infer summary statistics about the complexity of a nation's economic production. It's a pretty interesting idea, particularly since they can do it for time series data and make arguments about growth:
Hausmann and Hidalgo give their take on this by comparing the Economic Complexity Index for Ghana and Thailand. The lessons are resonant for aid agencies. Both countries had similar levels of schooling in 1970, and Ghana expanded education more vigorously than Thailand in the subsequent 40 years, supported of course by external assistance and policy recommendations.
Despite this, “Ghana’s economic complexity and income stagnated as it remained an exporter of cocoa, aluminium, fish and forest products. By contrast, between 1970 and 1985 Thailand underwent a massive increase in economic complexity, equivalent to a change of one standard deviation in the Economic Complexity Index. This caused a sustained economic boom in Thailand after 1985. As a consequence, the level of income per capita between Ghana and Thailand has since diverged dramatically.”
The Economic Complexity Index has been shown to be a better predictor of economic growth than a number of other existing development indicators. For example, as reported in the Economist last week, it outstrips the WEF index of competitiveness by a factor of 10 in terms of the accuracy of its predictions. It also outperforms the World Governance Indicators and the standard variable used to measure human capital as predictors of growth.
All in all fascinating. The site for the atlas is here. Go play around.
11.13.2011
Empirical evidence that hard work can make the world a better place
Sometimes when it's the weekend and you need a motivational break from furiously analyzing-data-while-writing-two-papers-while-applying-for-jobs-while-refereeing-stuff-and-washing-dishes, a movie on a historical success does the trick. Here are some of my favorites flavors of inspiration-caffeine [despite their historical inaccuracies...]:
Amazing Grace - ending slavery in the British Empire
(one of my favorite quotes is Edmund Burke on these events)
Ghandhi - liberating India and Pakistan
The Great Debaters - civil rights in the US
(maybe I like this because I met my fiance on our high-school's science olympiad team...)
Invictus - reconciliation in post-apartheid South Africa
(I remembered to post this because I was jogging in my Springbok's jersey!)
11.12.2011
Jobs in sustainability
Several of my colleagues are now looking for jobs in sustainability. Ram points us in the direction of this impressive database hosted by Duke (notably heavy in biological fields).
Searching NatureJobs for "sustainable" also brings up 134 positions at the time of posting. Also see job listings at the Association of Environmental and Resource Economists. Environmental economists can also see this page at Michigan State.
If you know of more listings, please post a comment. Maybe we'll assemble a database if we find enough.
11.09.2011
How do I find climate data for my research?
Once every three weeks a colleague (usually in the social sciences) emails me to ask about whether a climate data set of type X exists or what the pros/cons of various datasets are. I'm always happy to help, but it's useful to know that there are multiple websites that maintain collections of various kinds of climate/global environment data, and several have pages that specifically compare the array of data sets out there. If you're looking for data, a few clicks through these sites will give you a good sense of what's available.
- NCAR's Climate Data Guide (new and very nice)
- Columbia's IRI/LDEO Climate Data Library (interfaces with OPeNDAP, making download easy)
- NOAA's Earth System Research Laboratory Gridded Data Collection
- Reanalysis.org (discussed briefly here)
- IPCC Data Distribution Center (both historical and future projections are here)
- RealClimate Data Sources Page
All of these sites are listed in our meta-resources page.
11.08.2011
Open access textbooks

As a bonus, the textbooks are organized to reflect the structure of pre-existing textbooks, so students unable to afford expensive textbooks can read the same material that their professor assigns to the rest of the class. But I can imagine professors [particularly in low/middle-income, but highly-networked, countries] simply assigning the Boundless version of the textbook rather than bothering with lip-service to the original publication.
Some impressive points from their FAQs
How are Boundless Textbooks Made?Boundless Textbooks are created in a 3-step process:
- We curate the highest quality open source educational content and vet it with our team of top educational professionals from Harvard, MIT, Columbia, UC Berkeley, and other top institutions.
- We serve the open source educational content to cover the same material and concepts you are covering in your class and assignments.
- We make your Boundless Textbook digitally available from any computer at anytime and integrate the ability to instantly share notes, highlights and more with classmates and friends.
Do Boundless textbooks cost any money?No. Boundless Textbooks are 100% free.
How long do I get access to Boundless Books?You get universal access to your Boundless textbooks for life. There are no rental periods or other limitations.
How are the books free?Over the past 15 years, leading individuals and institutions, including MIT, Rice, Yale, and others, have begun releasing high quality educational content for others to use. This content is know as “Open Educational Resources (OER)”.
Recently, various state governments and the US government have begun investing Billions of dollars to continue creating more high quality open content (yes, that’s Billions with a B).
The Boundless Team organizes, edits and improves this content so that students can access the exact material that they need, whenever they need it.
Coupled to projects like OLPC, efforts like this could have big impacts on primary and secondary education as well.
11.06.2011
Islam, Peace, and the Hajj

We estimate the impact on pilgrims of performing the Hajj pilgrimage to Mecca. Our method compares successful and unsuccessful applicants in a lottery used by Pakistan to allocate Hajj visas. Pilgrim accounts stress that the Hajj leads to a feeling of unity with fellow Muslims, but outsiders have sometimes feared that this could be accompanied by antipathy toward non-Muslims. We find that participation in the Hajj increases observance of global Islamic practices, such as prayer and fasting, while decreasing participation in localized practices and beliefs, such as the use of amulets and dowry. It increases belief in equality and harmony among ethnic groups and Islamic sects and leads to more favorable attitudes toward women, including greater acceptance of female education and employment. Increased unity within the Islamic world is not accompanied by antipathy toward non-Muslims. Instead, Hajjis show increased belief in peace, and in equality and harmony among adherents of different religions. The evidence suggests that these changes are likely due to exposure to and interaction with Hajjis from around the world, rather than to a changed social role of pilgrims upon return.Tightly defined identification strategy, great data, and beautiful, encouraging results about human nature. What more could you ask for? Eid mubarak, everyone.
*A non-gated version of the paper is here.
11.04.2011
"On the Absorption and Radiation of Heat by Gaseous Matter"
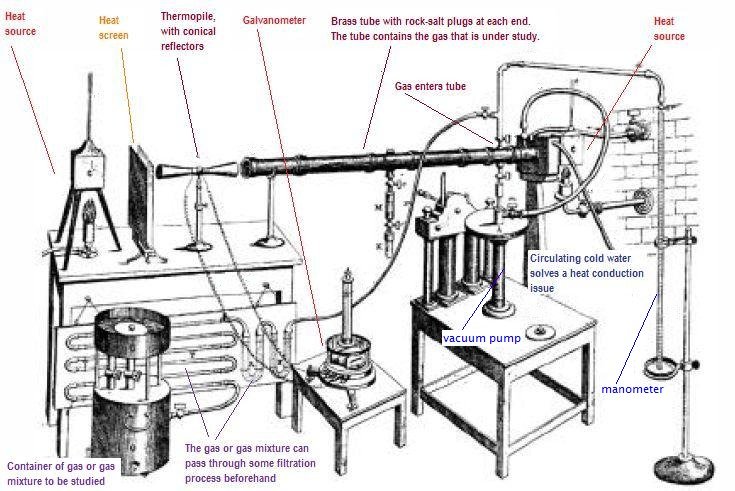
Further, I purified the air of the laboratory so well that its absorption was less than unity; the purified air was then conducted through two U-tubes filled with fragments of clean glass moistened with distilled water. Its neutrality when dry proved that all prejudicial substances had been removed from the air; and in passing throuugh the U-tubes it could have contracted nothing save the pure vapour of water. The vapour thus carried into the experimental tube exerted an absorption 90 times as great as that of the air which carried it.The emphasis is Tyndall's, and the excerpt comes from this article demonstrating water vapor's extraordinary capacity to absorb infrared radiation. Other highlights include papers on refraction (or 'refrangibility' if you like old-timey science), demonstrating thermal transfer at different parts of the spectrum (note the peak in the infrared in table 1), and quantifying the thermal capacity of infrared-absorbing (also known as "greenhouse"; note tables 1 and 2) gases.
All of which is really just to reiterate one of my favorite student / concerned scientist / chatting-about-climate-with-the-skeptical talking points: our understanding of climate's relationship to greenhouse gases is very, very old. Tyndall was showing that "carbonic acid" (CO2) was opaque to infrared in 1862, alongside other such notable gases as NOx and "marsh gas" (methane). That a radical increase in the atmosphere's concentration of these *very* absorptive gases would lead to additional warming is about as elementary of a scientific postulate as can be.
Subscribe to:
Posts (Atom)