1.31.2012

Volcanoes and the Little Ice Age

The Little Ice Age is the period in the middle of the last millennium when global temperatures seem to have been particularly low. It's famous for, among other things, the bias towards winter scenes in European landscape paintings during that period, but there is still much disagreement over why it occurred. In today's issue of Geophysical Research Letters a large team of researchers from UC Boulder's NCAR and the University of Iceland present evidence that it was caused by volcanoes:

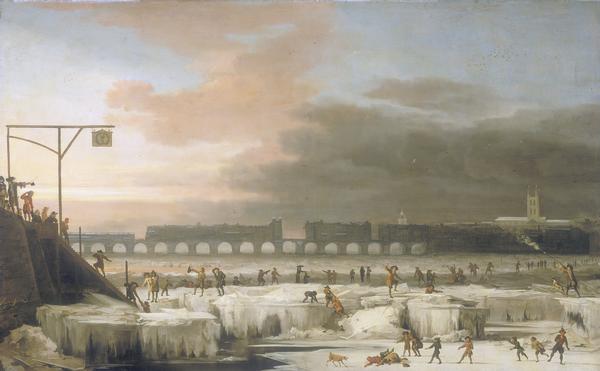
Abrupt onset of the Little Ice Age triggered by volcanism and sustained by sea-ice/ocean feedbacks
Northern Hemisphere summer temperatures over the past 8000 years have been paced by the slow decrease in summer insolation resulting from the precession of the equinoxes. However, the causes of superposed century-scale cold summer anomalies, of which the Little Ice Age (LIA) is the most extreme, remain debated, largely because the natural forcings are either weak or, in the case of volcanism, short lived. Here we present precisely dated records of ice-cap growth from Arctic Canada and Iceland showing that LIA summer cold and ice growth began abruptly between 1275 and 1300 AD, followed by a substantial intensification 1430–1455 AD. Intervals of sudden ice growth coincide with two of the most volcanically perturbed half centuries of the past millennium. A transient climate model simulation shows that explosive volcanism produces abrupt summer cooling at these times, and that cold summers can be maintained by sea-ice/ocean feedbacks long after volcanic aerosols are removed. Our results suggest that the onset of the LIA can be linked to an unusual 50-year-long episode with four large sulfur-rich explosive eruptions, each with global sulfate loading >60 Tg. The persistence of cold summers is best explained by consequent sea-ice/ocean feedbacks during a hemispheric summer insolation minimum; large changes in solar irradiance are not required.
The aerosol forcing argument is interesting as for a long time the Little Ice Age was hypothesized to be entirely the result of the above-mentioned "hemispheric summer insolation minimum," also known as the Maunder Minimum. Some recent work has argued that the decrease in solar activity wouldn't have been large enough to trigger substantial cooling, and this paper to a certain degree is an answer to that. That said, as with all paleoclimate work, this is essentially an attempt to engage in "forensic" climatology using proxy measures, and getting to answers with certainty is as difficult as it is in, say, archaeology.

I should also note, since several readers have asked recently about geoengineering, that the cooling detailed here is mechanistically the same as using stratospheric sulfate aerosols to arrest anthropogenic climate change. The potential risks of doing so should be self-evident.

1.30.2012

Postcards from the Anthropocene: Pollution's impact on tornadoes

Daniel Rosenfeld and Thomas L. Bell have a new paper out in the Journal of Geophysical Research arguing that the weekly cycle of aerosol pollutants resulting from human activity is likely to blame for the similarly-timed weekly cycle in tornado activity (h/t Luke):
Why do tornados and hailstorms rest on weekends?
This study shows for the first time statistical evidence that when anthropogenic aerosols over the eastern United States during summertime are at their weekly mid-week peak, tornado and hailstorm activity there is also near its weekly maximum. The weekly cycle in summertime storm activity for 1995–2009 was found to be statistically significant and unlikely to be due to natural variability. It correlates well with previously observed weekly cycles of other measures of storm activity. The pattern of variability supports the hypothesis that air pollution aerosols invigorate deep convective clouds in a moist, unstable atmosphere, to the extent of inducing production of large hailstones and tornados. This is caused by the effect of aerosols on cloud drop nucleation, making cloud drops smaller and hydrometeors larger. According to simulations, the larger ice hydrometeors contribute to more hail. The reduced evaporation from the larger hydrometeors produces weaker cold pools. Simulations have shown that too cold and fast-expanding pools inhibit the formation of tornados. The statistical observations suggest that this might be the mechanism by which the weekly modulation in pollution aerosols is causing the weekly cycle in severe convective storms during summer over the eastern United States. Although we focus here on the role of aerosols, they are not a primary atmospheric driver of tornados and hailstorms but rather modulate them in certain conditions. 
For a general audience article check out the write up at National Geographic, here. Of relevance is a variety of prior work on weekly weather cycles such as this paper in Nature and this paper also by Dr. Bell.

Note the graph showing weekly cycles of tornadoes, hail storms, and PMs 10 and 2.5. I think someone just violated a whole bunch of exclusion restrictions...


1.27.2012

Weekend Links

1) Gulag for Gaijin

2) The sustainability of sustainability (via Luke)

3) Ultramapping

4) US upgrades plant hardiness zone maps

5) "No Need to Panic About Global Warming" - a charateristically nuanced and objective WSJ op-ed

6) On the financial sector and public choice (via bb)

7) Potsdam, IASS, and the Santa Fe Institute are holding a summer school in Global Sustainability (via Sol)

8) Udacity and the future of online universities (via MR)

We are not an ‘eco-company’...

The use of sustainability-related buzz-words in corporate marketing can get pretty tiresome/silly, so when I ran across this Environment Policy statement by Whitelines, I found it refreshing.  Corporations, please take note.
Environment policy 
“Are you an ‘eco-company’?” 
We are not an ‘eco-company’ and have never looked at ourselves as ‘eco’. 
We just do what we think all companies­ should do: take all possible responsibility 
for the environment. Just that simple. 
We talk about the life of the planet here and it’s of course a no-brainer, we must all strive to eliminate the harm we cause! This statement shouldn’t be considered specifically ‘eco’ but just common sense. 
As some of you already know we were among the first, if not the very first paper company in the world to mark all our products with a Carbon Footprint label and later on also with Zero Carbon Footprint. 
We can’t do that now. 
Right now we are in a sourcing situation where we don’t have all data for the Life Cycle Analysis which is the foundation­ for a Carbon Footprint label. And as we don’t want to claim taking responsibility for something­ we can’t guarantee we will instead focus on other actions.­ 
Whitelines will continue for the time being to use a Swedish totally Carbon Free Paper in most of our products.­ (This means a paper where no Carbon Dioxide­ from fossil fuels is being emitted during production, a very good thing actually). 
No one would be happier than we if other companies would be comparable with us in terms of taking this responsibility. Imagine if we all make the resposibility for the environment an essential.
I found the Swedish site when I was looking at a statement on the back of one of their notebooks (which I recommend, btw) and was curious how they did their carbon accounting.

From a corporate social responsibility standpoint, this reads like it represents an interesting shift in focus.  Instead of giving companies extra brownie-points for having implemented some small program that reduces their environmental footprint by a tiny amount, perhaps we should simply expect that companies optimize their environmental performance and then penalize them heavily if they're not up to some minimal baseline-level of performance.  The current baseline expectation of 'no responsibility' means we reward pretty trivial production changes that probably don't have meaningful impacts.

I also thoroughly appreciate their acknowledgement of uncertainty in their carbon accounting.  If only we could all be that honest...

1.25.2012

Global Policy Journal

I ran across a copy of this new journal in the lounge of the WWS.  It looks pretty interesting and boasts an impressive editorial board.  I like their approach of focusing on global issues while pursuing interdisciplinary and applied authors/readers (and I don't know any other journals that have had a contribution by General David Petraeus).

Here's the editorial statement:

Global Policy has a multi-disciplinary, interdisciplinary and international outlook that is committed to developing the accuracy, forward lookingness and policy relevance of academic research. It will not privilege a particular ethnocentric approach but will reflect a multiplicity of approaches that are indicative of the emergence of a global system of multipolar governance and policymaking. 
The editors’ approach to selecting material will be:
Committed to advancing the academic study of global policy and the politics in which it is embedded; Open  to interdisciplinary and transdisciplinary contributions; Reflexive in its consideration of diverse political discourses on global problems; Engaged in respect of its contribution to public debate and understanding of urgent global policy issues and; Serious in its commitment to the publication of only world class academic scholarship and the work of key public and private figures or authorities. 
The scope of Global Policy’s content can be specified by a number of criteria:
  • 01. Globally relevant risks and collective action problems.
  • 02. Policy challenges with global impact.
  • 03. Competing and converging discourses of global policy and governance.
  • 04. Case studies of policy with clear lessons for other countries and regions.
  • 05. The interrelationship between policy, politics and institutions at the global level, with implications for institutional design. 
  • 06. Conceptual, theoretical and methodological innovations needed to explain and develop global policy.
The editors are committed to developing both the highest standards of scholarship and evidence based reasoning by authors, with the scholarly articles subject to rigorous peer review. We are at the same time committed to the effective communication of research in the most accessible and professional fashion. We shall use a set of editorial conventions that do not compromise on accuracy and the proper explanation of methods, but that do systematically prioritise readers’ interests in the excellent presentation of data and complete clarity of exposition. We shall seek to engage meaningfully with the widest range of readers and contributors

1.23.2012

spatial-analyst.net

While looking for some remote sensing data last week, I ran into spatial-analyst.net, which I think deserves the FE-website-discovery-of-the-month award.  The wiki has pages dedicated to things like "How to download and resample MODIS images".  It's geared towards R users, and I'm kind of a Matlab guy, but it's still clearly useful to both parties.  For example, I really like their page pointing to various global datasets, some interesting examples of which are here:

Lighting flash rate
Second principle component of recent population density changes
Commercial shipping density
Carbon density tones of C / ha.
Estimated travel time to major cities (>50k) in hours

1.20.2012

Four data points, La Niña, and the flu

Columbia's Jerry Shaman* and Harvard's Marc Lipsitch have a new paper out in PNAS that argues that La Niña events may be driving the pandemic flu cycle by changing the pattern of bird migration:
We find that the four most recent human influenza pandemics (1918, 1957, 1968, and 2009), all of which were first identified in boreal spring or summer, were preceded by La Niña conditions in the equatorial Pacific. Changes in the phase of the El Niño–Southern Oscillation have been shown to alter the migration, stopover time, fitness, and interspecies mixing of migratory birds, and consequently, likely affect their mixing with domestic animals. We hypothesize that La Niña conditions bring divergent influenza subtypes together in some parts of the world and favor the reassortment of influenza through simultaneous multiple infection of individual hosts and the generation of novel pandemic strains. We propose approaches to test this hypothesis using influenza population genetics, virus prevalence in various host species, and avian migration patterns.
Here is a BBC article summarizing the paper. Aside from the fact that this paper is, to my eye, a great argument for robust interdisciplinary training (climate + public health + microbiology), it's also a good example of a fundamental statistical truism: just because the data are sparse doesn't mean you can't say something meaningful. There have been only four pandemic influenzas in the past century, but the likelihood that they would all start at the same point in the ENSO cycle is low (Shaman and Lipsitch estimate it at P=0.069). That on its own wouldn't necessarily be meaningful, but when combined with the fairly credible potential mechanism the authors outline one ends up with a pretty plausible hypothesis. Whether it holds remains to be seen (hence the apposition in the title) but it's a lovely first paper on what might end up being a very important phenomenon.

* Jerry Shaman presented a version of this paper at the session Sol coorganized at AGU (video here).

Weekend Links

1) 100 essays on economics in Africa via Udadisi

2) Am I wasting my time organizing email?

3) New, completely antibiotic-resistant TB strain discovered in India

4) Randomized control trials in social network research (something I've been arguing for for a while...) via @TheBrowser

5) “In nature, most of the normal signals are sparse.” - Faster fast Fourier transforms out of MIT

6) Groundbreaking or definitive? Journals need to pick one. via Andrew Gelman

1.19.2012

Americans do care about their climate... they just might not realize it

Climate Change, Crop Yields, and Internal Migration in the United States
Shuaizhang Feng, Michael Oppenheimer, Wolfram Schlenker

We investigate the link between agricultural productivity and net migration in the United States using a county-level panel for the most recent period of 1970-2009. In rural counties of the Corn Belt, we find a statistically significant relationship between changes in net outmigration and climate-driven changes in crop yields, with an estimated semi-elasticity of about -0.17, i.e., a 1% decrease in yields leads to a 0.17% net reduction of the population through migration. This effect is primarily driven by young adults. We do not detect a response for senior citizens, nor for the general population in eastern counties outside the Corn Belt. Applying this semi-elasticity to predicted yield changes under the B2 scenario of the Hadley III model, we project that, holding other factors constant, climate change would on average induce 3.7% of the adult population (ages 15-59) to leave rural counties of the Corn Belt in the medium term (2020-2049) compared to the 1960-1989 baseline, with the possibility of a much larger migration response in the long term (2077-2099). Since there is uncertainty about future warming, we also present projections for a range of uniform climate change scenarios in temperature or precipitation.

1.16.2012

Ask an economist

Or, more aptly, ask 40 of the top economists alive what they think about a given policy statement. I found out about the IGM Forum's Economic Experts Panel from Luke Stein while at the American Economic Association meeting last weekend. The responses are best for yielding insight into what is and is not considered an open question from the point of view of economics. It's only been going on for a little while as far as the website seems to indicate, but the responses are illuminating. A sampling:

The diversity of opinions on that last one make it particularly worthwhile.

1.13.2012

Climate and conflict con't

I never really made good on the promise to explain our paper from this summer (Hsiang, Meng and Cane, Nature 2011), but I've spent effort making it accessible elsewhere, so I'm cross-referencing here.
  • A short summary that I wrote for Earth Magazine is here.
  • I present the results in a 30 min non-technical talk to policy-makers at the Woodrow Wilson Center here (starting at 43:00, but the other talks are also interesting).
  • The original article is un-pay-walled here
  • Reposting this Nature Climate Change article discussing the literature (not mine).

1.11.2012

Second Interdisciplinary Ph.D. Workshop in Sustainable Development


This is put together by folks at Columbia and was a big success last year.  I would definitely encourage PhD students to apply.
CALL FOR PAPERS
Second Interdisciplinary Ph.D. Workshop in Sustainable DevelopmentApril 20th-21st, 2012: Columbia University in the City of New York, USA The graduate students in sustainable development at Columbia University are convening the second Interdisciplinary Ph.D. Workshop in Sustainable Development (IPWSD); scheduled for April 20th-21st, 2012, at Columbia University in New York City. 
The IPWSD is a conference open to graduate students working on or interested in issues related to sustainable development.  It is intended to provide a forum to present and discuss research in an informal setting, as well as to meet and interact with similar graduate student researchers from other institutions.  In particular, we hope to facilitate a network among students pursuing in-depth research across a range of disciplines in the social and natural sciences, to generate a larger interdisciplinary discussion concerning sustainable development.  If your research pertains to the field of sustainable development and the linkages between natural and social systems, we encourage you to apply regardless of disciplinary background. 
For details, please see the call for papers, or visit our conference website where a detailed list of topics, conference themes and other information is available. 
Please share this information widely with graduate students and other interested parties. We look forward to seeing you in New York City in April! 
With kind regards,The Second IPWSD Planning Committee,website: http://blogs.cuit.columbia.edu/sdds/schedule-events/ipwsd_2012/contact: cu.sdds.ipwsd@gmail.com

1.09.2012

"Boxplot regression" - my new favorite non-parametric method

I like non-parametric regressions since it lets you see more of what's going on in data (see this post too).    I also like when people plot more than just a mean regression, since seeing the dispersion in a conditional distribution is often helpful.  So why don't people combine both to make a suped-up graph with the best of both worlds?  Probably because there's no standard command in software packages (that I know of, at least).  So I decided to fix that.  Introducing boxplot regression! I'm not the first to do this, but I'm giving this code away for free, so I'm taking the liberty of making up a name since I haven't seen one before (heaven knows that I may be way off here...).

For one of our projects, Michael Roberts (his blog is solid) suggested we mimic this plot from one of his earlier papers.  This seemed like such a good idea, I wrote a Matlab function up so I can make a similar plot for every paper I write from here on out.

The function takes a continuous independent variable and bins it according to an arbitrary bin-width.  It then makes a boxplot for values of the dependent variable over each bin in the independent variable.  The result is basically a non-parametric quantile regression showing the median, 25th and 75th percentiles.  I then plot the mean for each bin overlaid as a line, so one can see how more traditional non-parametric mean regressions will compare.  Simple.

I'm not the first, but I'm not sure why this isn't done more often. Boxplots are usually used to compare distributions over qualitatively different groups, like races, sexes or treatment groups.  But it's not a huge conceptual leap to discretize an independent variable so we can apply the approach to standard regression. It's just annoying to code up.

My boxplot regression function is here (along with a utility to bin any variable without making the plot).  Now making this plot takes a single command.

Example: We take a globally gridded dataset from the SAGE group (Google Earth file of it here) and do a boxplot regression of area planted with crops on the agriculture suitability index of that grid cell:


We get a bi-variate graph packed full of information, right?  I hope Tufte would approve.  If you specify >25 bins, I've set the function to switch to a slightly more compact style for the boxplots.


Enjoy!

[If you like this, see this earlier post too. Help-file cut and pasted below the fold.]

1.05.2012

Global tropical deforestation slowing down

Our colleague Jan Christoph von der Goltz points us to this new working paper by Wheeler, Kraft, and Hammer at the Center for Global Development:
This report summarizes recent trends in large-scale tropical forest clearing identified by FORMA (Forest Monitoring for Action). Our analysis includes 27 countries that accounted for 94 percent of clearing during the period 2000–2005. We highlight countries with relatively large changes since 2005, both declines and increases. FORMA produces indicators that track monthly changes in the number of 1-sq.-km. tropical forest parcels that have experienced clearing with high probability. This report and the accompanying spreadsheet databases provide monthly estimates for 27 countries, 280 primary administrative units, and 2,907 secondary administrative units. Countries’ divergent experiences since 2005 have significantly altered their shares of global clearing in some cases. Brazil’s global share fell by 11.2 percentage points from December 2005 to August 2011, while the combined share of Malaysia, Indonesia, and Myanmar increased by 10.8. The diverse patterns revealed by FORMA’s first global survey caution against facile generalizations about forest clearing in the pantropics. During the past five years, the relative scale and pace of clearing have changed across regions, within regions, and within countries. Although the overall trend seems hopeful, it remains to be seen whether the decline in forest clearing will persist as the global economy recovers.
CGD blog link here. While the overall trend is good news, the point about heterogeneity is well taken. See, for example, this time series map of Borneo's forest cover, and in particular the jump between 2000 and 2010:
Source: UNEP GRID

1.03.2012

The limits of expert credibility

Jesse Shapiro has a pretty great working paper out: On the Limits of Expert Credibility: Theory and an Application to Climate Change
Abstract: A neutral expert sends an informative message to an uninformed voter. An interested party can pay a cost to replace the expert’s message with its own. The more informed is the expert, the greater is the interested party’s incentive to replace the expert’s message. In equilibrium, making the expert more informed has no effect on the voter’s beliefs and strictly reduces social welfare. The model thus implies an endogenous limit on how credible a purported expert can be. I apply the model to public skepticism about climate change.
The explanation of the intuition behind the model is particularly great:
The intuition for the result is simple. In equilibrium there must be some chance the message is from the expert or the voter would ignore it entirely. Therefore any equilibrium must involve mixing on the part of the informed parties. As a result, the informed parties must be indifferent to hiring an advocate. At the point of indifference, the cost of hiring an advocate must equal the benefit. The benefit to hiring an advocate is proportional to the credibility the voter assigns to the message. The credibility of the message is therefore pinned down, not by the information of the expert, but by the cost of hiring an advocate. The model thus implies an endogenous limit on how informed the voter can be, determined entirely by the market for credentialed advocates. Improved expert information makes society worse off, because it has no impact on voter information and results in greater use of costly advocates.
...as is the specific explanation of results as they apply to the climate change debate:
I apply the model to the climate change debate. As I show in the paper, each side of the debate wields credentialed, credible-sounding experts. Each side accuses the other of exaggerating or falsifying evidence to suit its agenda. It is difficult for the public at large to independently review the scientific evidence on climate change or determine who speaks for the scientific community. The model predicts that under such circumstances the public’s belief will not converge to the scientific consensus. Consistent with this prediction, I show that even highly educated survey respondents express persistent (and growing) skepticism both about climate change itself and about the strength of the scientific consensus.