8.28.2010

A new mechanism to consider when measuring climate impacts on economies

[A shorter (and more heavily copy-edited) version of this post was published in EARTH Magazine, read it here.]

My paper Temperatures and tropical cyclones strongly associated with economic production in the Caribbean and Central America was recently published in the Proceedings of the National Academy of Sciences. Because the paper is a little technical, here is a presentation of the results that everyone should be able to understand.

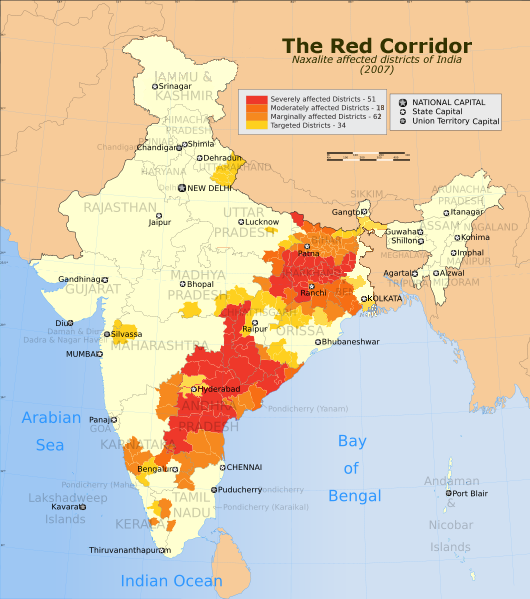
Following countries over time, years with higher than
normal temperatures during the hottest season 
(Sep-Oct-Nov) exhibit large reductions in output across  
several non-agricultural industries.
Central finding:
Economic output across a range of industries previous thought of as "not vulnerable to climate change" respond strongly to changes in temperature.  The data suggest that the response is driven by the direct human response to high temperatures: people generally are less productive and tire faster when it's hot.  This impact, which appears to be quite large, has not been factored into any previous estimates for the global cost of climate change.

Background
Governments and organizations around the world are trying to figure out how much money we should spend to avoid climate change.  The answer isn't obvious.  On the one hand, climate change seems ominous and we'd like to spend lots of money to avoid it. But on the other hand, if we spend money on avoiding climate change, we can't spend it on other important things. For example, imagine that the United Nations has a million dollars it can spend. Should it spend it on building solar panels or building schools?  Both are clearly important. But if we want to get the most "bang for our buck," we need to figure out what the benefits of these two types of investments are.

A whole research industry has sprung up around the cost-benefit analysis of preventing climate change.  How much money should be spent to prevent climate change by investing in more expensive low-carbon technologies? Who should pay for it and when should they pay for it?  A tremendous amount of intellectual machinery has been applied to this problem by many extremely smart people.  The basic approach is to build models of the world economy-climate system and try to see what happens to the climate and the economy under different global policies.  These models are used by governments around the world to determine what they think the best climate policies are and how much they should spend on the problem.

However, there is something of a dark secret to this approach: we don't really know what will happen to us if the climate changes.  We have a fairly good grasp of how much it might cost to implement different energy policies. And we've learned a lot about how different energy policies will translate into global climate changes.  But when it comes to figuring out how those climate changes translate into costs to society (both financial and non-monetary), we end up having to do a lot of guesswork.

It's unfair to say we know nothing about the costs of climate change, but what we understand well is limited to certain types of impacts.  For example, we have been doing extensive research on the possible agricultural impacts for years. We've also done studies for a lot of the health impacts.  But most research stops there.  For example, we only are beginning to learn about the effect of climate on people's recreation and perceived happiness.  We're also only beginning to learn about the effect of climate on violence and crime.  We know a lot (but not nearly everything) about the effect of climate on ecosystems, but we don't really understand how ecosystems affect us, so we still can't estimate this impact on society. The list goes on.

Now we know a lot about climate impacts on health and agriculture because people have studied those impacts a lot.  Why did we study those kinds of impacts so much? I'm not sure. Maybe because the importance of climate on health and agriculture is obvious (eg. my plants on the windowsill died after just two days of this summer's heat wave).

The fact that we only really understand agricultural and health impacts of climate change is very important in the cost benefit analyses I mentioned earlier.  When governments are trying to figure out the best policies, they add up the known costs of preventing climate change and they add up the known benefits of preventing climate change.   If the costs outweigh the benefits, then that suggests we shouldn't spend much money to stop climate change.  But there is a natural asymmetry in this comparison between costs and benefits: we know all (or most of) the costs but only know the health and agricultural benefits.  So when we add up the costs of energy policies, the numbers tend to look very big.  But when we add up the known benefits of those policies, we add up the health benefit and the agricultural benefits, but we have to stop there because we don't know what else will be affected by climate change.  Maybe it shouldn't be surprising that many cost-benefit analyses find that climate change is not worth spending a lot of money on.

But what we know about climate impacts in non-health and non-agricultural sectors is slowly improving.  In a 2009 working paper, Dell, Jones and Olken did something very simple and got very surprising results.  They compared the economic output of countries over time with year-to-year changes in the weather of those countries.  They found that in poor countries, small increases in the annual average temperature of a country lead to large drops in economic output of that country.  The approach sounds simple, right? It is.  But the results are startling because they found such a large effect of temperature. They estimate that a 1C increase in average temperatures decreases a poor country's gross domestic product (GDP) by 1.1% in the same year. To get a sense of how big this effect is, recall that the economy of the Unites States shrank by 2.4% in 2009 and people are upset about the state of the economy.

Because the effect found by Dell et al. is so large, many people have been skeptical that it represents something real (note from my own unpublished work: I can corroborate their results using different data sets from the ones they used).  To check these results further, in 2010, Jones and Olken tried to looking for a similar effect in the exports of these countries and found that they also responded strongly to temperature changes.  Do people believe the general result yet? I'm not sure.  But part the skepticism seems to persist because its hard to know why poor countries should be so strongly affected by temperature.  One reason for this is that it's very hard to know what mechanisms are at work when one is only looking at macro-economic data.  Further, thinking of ways in which temperature affects economics this strongly and systematically across countries seems to be hitting the limits of many peoples' imaginations. This is where my study comes in.

8.27.2010

Quick Hit: Naxalites and India's Regional Resource Curse


Foreign Policy has a great article on the effect of mining (principally coal, but also iron and other metals) on two of India's poorest states, especially in fueling the ongoing Maoist / "Naxalite" rebellion. There's a couple of things that are pretty interesting in the article
  1. This is a pretty strictly regional "resource curse" dynamic. Normally one is taught to think of the resource curse operating on national levels (Dutch Disease, kleptocrat dictators, etc.) but it's interesting to see that that need not be the case. That made me appreciate how much the political economy and power dynamics in Appalachia are really just a developed-country, regional resource curse.
  2. Who knew India had that much coal? A classic "folk empirical result," if you will, of geographically-inclined development economists is that the countries which prospered during the industrial revolution had huge coal reserves. Not that China doesn't, too, but still: India? I clearly need to read more
  3. Calling the Maoist rebels "Naxalites" is apparently not accurate, which is interesting to hear since I've heard that term used by multiple people in the past few years.
  4. "If you want to be somebody in Jharkand, just kill an aid worker" manages to pack so much of the troubles of development work into so few words that it should count as haiku.
The article also has some great photography. Worth clicking through.

8.24.2010

Scalability and path dependency in urban planning


Providing a cogent reminder of the fact that scale matters in things like economics and urban planning just like it does in the natural world, a traffic jam between Jining and Beijing is now entering its 9th straight day of existence. Hat tip on that goes to Tyler Cowen at Marginal Revolution.

I lived in Beijing for the better part of a year after college and the traffic was awful even then. I remember one of the first things I heard about transport in the city was that the percent of urban area devoted to roads (or "road area ratio" in planning parlance) was vastly less than in other comparably-sized cities. Poking around a bit on Google Scholar yields a figure around 12% vs. cities like London being in the range of 35% and American commuter cities being in the range of 45% (Ge and Ping, 2008).

Abstracting a bit more, news like this makes me more sanguine about predictions that India and China are seeking to completely emulate American lifestyles, thereby placing an unbearable load on the Earth's resource base. If very deeply-rooted structural differences make owning personal vehicles this much of a pain this early in a country's development trajectory then I think the long-term prospects have to be fundamentally different. Recall that the Americas (ok, and Australia) were built more or less from scratch over the past two centuries while a lot of new transport and housing technologies were being developed and demographic changes were being realized. Expecting countries with longer histories and different cultural biases to have their pre-existing large cities turn into L.A. just because per capita incomes have gone up seems a bit simplistic.

Though I'm sure traffic in L.A. sometimes seems to last for days on end.

*Image copyright AP.

8.17.2010

timetric.com

A new website launched by a group in the UK makes accessing, analyzing and sharing time series data simple:

http://timetric.com/

Similar to gapminder.org, the target audience is the public.  The site is well put together, letting me make this graph and embed it in about a minute.


Data from Timetric.

To view this graph, please install Adobe Flash Player.


According to their About page:


timetric.com's full of indexes and indicators about nearly every part of your life and your business, from finance to weather to politics to sport. We're here to help you find the data you need, to use it and make sense of it, and to compare it with your own data. (The fancy name for this sort of thing is time series analysis).
We want to make your insights easy for you to share, so you can embed the indexes on timetric.com into your blogs and websites, or share them on Twitter, with just a couple of clicks.
And so you can compare your own data with the indexes we've collected, it's really easy to import your own data; you can upload Excel (or CSV) spreadsheets or enter it in by hand.
For the programmers out there, we've got an API, and we support all the good stuff like OAuthOpenID and OpenSearch, so it's easy to integrate Timetric with other services.
We're here to help you understand the world better, and to help you make better decisions through statistics, and we're just getting started.


I'm a big supporter of all these efforts to get data out into the public domain and accessible to everyone.  Its extremely difficult to get a sense of "the world" just looking at newspapers and other media, so making this kind of data accessible is another step in the right direction.

I've added the site to our Resources page.

8.11.2010

Geoengineering?

I was just on the website of EARTH Magazine (a magazine published by the American Geological Institute and whose target audience is the scientifically-inclined) and in the upper right corner was a simple online poll for visitors to click on.  The question and results are below.  I'm not even sure how I feel about geoengineering, but I find this simple graph fascinating.  


8.09.2010

Two and three-dimensional non-parametric regressions

A pet peeve of mine are people who run dozens of linear regressions but never check whether linearity  is a good assumption.  Often, people will run linear models and then look for non-linearities later.  But there's no point in estimating lots of linear models first if they might be meaningless.  For example, imagine a U-shaped curve of Y as a function of X.  In this case, estimating and declaring that a linear model estimates no relation between Y and X is not meaningful.  As a general rule, it's probably a better strategy to look for non-linearities early and often.

With the goal of searching-for-specifications in mind, its useful to have a method of non-parametric regression that's fast since the researcher will have to try many things. Locally weighted polynomial regressions are fairly slow, so the faster and simpler Nadaraya-Watson estimator (Nadaraya, 1964 and Watson, 1964) comes in handy.

My code for the NW estimator in Matlab is here.
(If your data is in Stata and you want to move it to Matlab, see my code for that here).

It contains 4 .m files. The file test.m will generate some random data and estimate the conditional mean with the NW estimator.  The code uses bootstrap-resampling to estimate confidence intervals. All models have flexible but fixed bandwidth.

With one dependent variable, NWbootstrap.m (with a normal kernel) and NWbootstrap_epkv.m (with an Epinechnikov kernel) are appropriate.

With two dependent variables,  NWbootstrap_epkv_3D.m is useful.  This should be used, for example, if you are looking for "interaction terms" in a multiple regression model (the slope of a function changes as a function of another variable).

UPDATE: A problem with dropping missing variables has been fixed.  The code drop_missing_Y is now in the NW toolbox to solve the problem.

All files have helpfiles with syntax. Below is a demonstration of the code.