When I first showed these results to people, more than one of my senior colleagues said "It can't be true, you made a mistake." But now that business faculty are working on the problem, I might be willing to declare that we have reached stage two of acceptance.
Severe Weather and Automobile Assembly Productivity
Gérard P. Cachon, Santiago Gallino and Marcelo Olivares
Abstract: It is expected that climate change could lead to an increased frequency of severe weather. In turn, severe weather intuitively should hamper the productivity of work that occurs outside. But what is the effect of rain, snow, fog, heat and wind on work that occurs indoors, such as the production of automobiles? Using weekly production data from 64 automobile plants in the United States over a ten-year period, we find that adverse weather conditions lead to a significant reduction in production. For example, one additional day of high wind advisory by the National Weather Service (i.e., maximum winds generally in excess of 44 miles per hour) reduces production by 26%, which is comparable in order of magnitude to the estimated productivity drop during the launch of a new vehicle. Furthermore, the location with the best weather (Arlington, Texas) only loses 2% of production per year due to the weather, whereas the location with the most adverse weather (Lordstown, OH) suffers an annual production loss of 11%. Our findings are useful both for assessing the potential aggregate productivity shock associated with inclement weather as well as guiding managers on where to locate a new production facility - in addition to the traditional factors considered in plant location (e.g., labor costs, local regulations, proximity to customers, access to suppliers), we add the prevalence of bad weather.
Welfare Costs of Long-Run Temperature Shifts
Ravi Bansal, Marcelo Ochoa
Abstract: This article makes a contribution towards understanding the impact of temperature fluctuations on the economy and financial markets. We present a long-run risks model with temperature related natural disasters. The model simultaneously matches observed temperature and consumption growth dynamics, and key features of financial markets data. We use this model to evaluate the role of temperature in determining asset prices, and to compute utility-based welfare costs as well as dollar costs of insuring against temperature fluctuations. We find that the temperature related utility-costs are about 0.78% of consumption, and the total dollar costs of completely insuring against temperature variation are 2.46% of world GDP. If we allow for temperature-triggered natural disasters to impact growth, insuring against temperature variation raise to 5.47% of world GDP. We show that the same features, long-run risks and recursive-preferences, that account for the risk-free rate and the equity premium puzzles also imply that temperature-related economic costs are important. Our model implies that a rise in global temperature lowers equity valuations and raises risk premiums.
Temperature, Aggregate Risk, and Expected Returns
Ravi Bansal, Marcelo Ochoa
Abstract: In this paper we show that temperature is an aggregate risk factor that adversely affects economic growth. Our argument is based on evidence from global capital markets which shows that the covariance between country equity returns and temperature (i.e., temperature betas) contains sharp information about the cross-country risk premium; countries closer to the Equator carry a positive temperature risk premium which decreases as one moves farther away from the Equator. The differences in temperature betas mirror exposures to aggregate growth rate risk, which we show is negatively impacted by temperature shocks. That is, portfolios with larger exposure to risk from aggregate growth also have larger temperature betas; hence, a larger risk premium. We further show that increases in global temperature have a negative impact on economic growth in countries closer to the Equator, while its impact is negligible in countries at high latitudes. Consistent with this evidence, we show that there is a parallel between a country's distance to the Equator and the economy's dependence on climate sensitive sectors; in countries closer to the Equator industries with a high exposure to temperature are more prevalent. We provide a Long-Run Risks based model that quantitatively accounts for cross-sectional differences in temperature betas, its link to expected returns, and the connection between aggregate growth and temperature risks.
More related material here.


11.14.2011
The Atlas of Economic Complexity

As readers will be well aware, the social accumulation of productive knowledge has not been universal: “The enormous income gaps between rich and poor nations are an expression of the vast differences in productive knowledge amassed by different nations.”
These differences are expressed in the diversity and sophistication of the things that each nation makes. In order to put knowledge into productive use, societies need to reassemble these distributed products through teams, organisations and markets. These issues are explored in detail in the Atlas, through the concept of the ‘product space’. This is a map which captures the products made by different countries in terms of their knowledge requirements
....
Hausmann, Hidalgo and their team have also developed an Index of Economic Complexity to represent their data systematically. This Index tells us about the richness of the product space of a given country, and by extension, is one useful indicator of the potential to grow.
In effect they're taking applied network techniques for measuring network density and size and using them to infer summary statistics about the complexity of a nation's economic production. It's a pretty interesting idea, particularly since they can do it for time series data and make arguments about growth:
Hausmann and Hidalgo give their take on this by comparing the Economic Complexity Index for Ghana and Thailand. The lessons are resonant for aid agencies. Both countries had similar levels of schooling in 1970, and Ghana expanded education more vigorously than Thailand in the subsequent 40 years, supported of course by external assistance and policy recommendations.
Despite this, “Ghana’s economic complexity and income stagnated as it remained an exporter of cocoa, aluminium, fish and forest products. By contrast, between 1970 and 1985 Thailand underwent a massive increase in economic complexity, equivalent to a change of one standard deviation in the Economic Complexity Index. This caused a sustained economic boom in Thailand after 1985. As a consequence, the level of income per capita between Ghana and Thailand has since diverged dramatically.”
The Economic Complexity Index has been shown to be a better predictor of economic growth than a number of other existing development indicators. For example, as reported in the Economist last week, it outstrips the WEF index of competitiveness by a factor of 10 in terms of the accuracy of its predictions. It also outperforms the World Governance Indicators and the standard variable used to measure human capital as predictors of growth.
All in all fascinating. The site for the atlas is here. Go play around.
11.13.2011
Empirical evidence that hard work can make the world a better place
Sometimes when it's the weekend and you need a motivational break from furiously analyzing-data-while-writing-two-papers-while-applying-for-jobs-while-refereeing-stuff-and-washing-dishes, a movie on a historical success does the trick. Here are some of my favorites flavors of inspiration-caffeine [despite their historical inaccuracies...]:
Amazing Grace - ending slavery in the British Empire
(one of my favorite quotes is Edmund Burke on these events)
Ghandhi - liberating India and Pakistan
The Great Debaters - civil rights in the US
(maybe I like this because I met my fiance on our high-school's science olympiad team...)
Invictus - reconciliation in post-apartheid South Africa
(I remembered to post this because I was jogging in my Springbok's jersey!)
Amazing Grace - ending slavery in the British Empire
(one of my favorite quotes is Edmund Burke on these events)
Ghandhi - liberating India and Pakistan
The Great Debaters - civil rights in the US
(maybe I like this because I met my fiance on our high-school's science olympiad team...)
Invictus - reconciliation in post-apartheid South Africa
(I remembered to post this because I was jogging in my Springbok's jersey!)
11.12.2011
Jobs in sustainability
Several of my colleagues are now looking for jobs in sustainability. Ram points us in the direction of this impressive database hosted by Duke (notably heavy in biological fields).
Searching NatureJobs for "sustainable" also brings up 134 positions at the time of posting. Also see job listings at the Association of Environmental and Resource Economists. Environmental economists can also see this page at Michigan State.
If you know of more listings, please post a comment. Maybe we'll assemble a database if we find enough.
Searching NatureJobs for "sustainable" also brings up 134 positions at the time of posting. Also see job listings at the Association of Environmental and Resource Economists. Environmental economists can also see this page at Michigan State.
If you know of more listings, please post a comment. Maybe we'll assemble a database if we find enough.
11.09.2011
How do I find climate data for my research?
Once every three weeks a colleague (usually in the social sciences) emails me to ask about whether a climate data set of type X exists or what the pros/cons of various datasets are. I'm always happy to help, but it's useful to know that there are multiple websites that maintain collections of various kinds of climate/global environment data, and several have pages that specifically compare the array of data sets out there. If you're looking for data, a few clicks through these sites will give you a good sense of what's available.
- NCAR's Climate Data Guide (new and very nice)
- Columbia's IRI/LDEO Climate Data Library (interfaces with OPeNDAP, making download easy)
- NOAA's Earth System Research Laboratory Gridded Data Collection
- Reanalysis.org (discussed briefly here)
- IPCC Data Distribution Center (both historical and future projections are here)
- RealClimate Data Sources Page
All of these sites are listed in our meta-resources page.
11.08.2011
Open access textbooks

As a bonus, the textbooks are organized to reflect the structure of pre-existing textbooks, so students unable to afford expensive textbooks can read the same material that their professor assigns to the rest of the class. But I can imagine professors [particularly in low/middle-income, but highly-networked, countries] simply assigning the Boundless version of the textbook rather than bothering with lip-service to the original publication.
Some impressive points from their FAQs
How are Boundless Textbooks Made?Boundless Textbooks are created in a 3-step process:
- We curate the highest quality open source educational content and vet it with our team of top educational professionals from Harvard, MIT, Columbia, UC Berkeley, and other top institutions.
- We serve the open source educational content to cover the same material and concepts you are covering in your class and assignments.
- We make your Boundless Textbook digitally available from any computer at anytime and integrate the ability to instantly share notes, highlights and more with classmates and friends.
Do Boundless textbooks cost any money?No. Boundless Textbooks are 100% free.
How long do I get access to Boundless Books?You get universal access to your Boundless textbooks for life. There are no rental periods or other limitations.
How are the books free?Over the past 15 years, leading individuals and institutions, including MIT, Rice, Yale, and others, have begun releasing high quality educational content for others to use. This content is know as “Open Educational Resources (OER)”.
Recently, various state governments and the US government have begun investing Billions of dollars to continue creating more high quality open content (yes, that’s Billions with a B).
The Boundless Team organizes, edits and improves this content so that students can access the exact material that they need, whenever they need it.
Coupled to projects like OLPC, efforts like this could have big impacts on primary and secondary education as well.
11.06.2011
Islam, Peace, and the Hajj

We estimate the impact on pilgrims of performing the Hajj pilgrimage to Mecca. Our method compares successful and unsuccessful applicants in a lottery used by Pakistan to allocate Hajj visas. Pilgrim accounts stress that the Hajj leads to a feeling of unity with fellow Muslims, but outsiders have sometimes feared that this could be accompanied by antipathy toward non-Muslims. We find that participation in the Hajj increases observance of global Islamic practices, such as prayer and fasting, while decreasing participation in localized practices and beliefs, such as the use of amulets and dowry. It increases belief in equality and harmony among ethnic groups and Islamic sects and leads to more favorable attitudes toward women, including greater acceptance of female education and employment. Increased unity within the Islamic world is not accompanied by antipathy toward non-Muslims. Instead, Hajjis show increased belief in peace, and in equality and harmony among adherents of different religions. The evidence suggests that these changes are likely due to exposure to and interaction with Hajjis from around the world, rather than to a changed social role of pilgrims upon return.Tightly defined identification strategy, great data, and beautiful, encouraging results about human nature. What more could you ask for? Eid mubarak, everyone.
*A non-gated version of the paper is here.
11.04.2011
"On the Absorption and Radiation of Heat by Gaseous Matter"
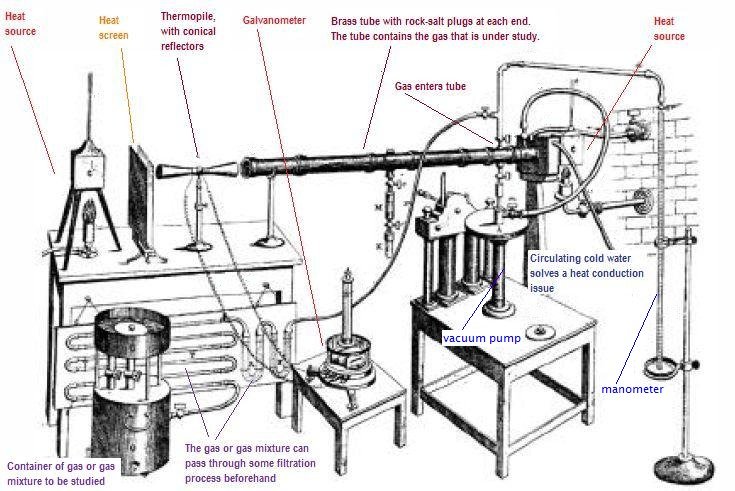
Further, I purified the air of the laboratory so well that its absorption was less than unity; the purified air was then conducted through two U-tubes filled with fragments of clean glass moistened with distilled water. Its neutrality when dry proved that all prejudicial substances had been removed from the air; and in passing throuugh the U-tubes it could have contracted nothing save the pure vapour of water. The vapour thus carried into the experimental tube exerted an absorption 90 times as great as that of the air which carried it.The emphasis is Tyndall's, and the excerpt comes from this article demonstrating water vapor's extraordinary capacity to absorb infrared radiation. Other highlights include papers on refraction (or 'refrangibility' if you like old-timey science), demonstrating thermal transfer at different parts of the spectrum (note the peak in the infrared in table 1), and quantifying the thermal capacity of infrared-absorbing (also known as "greenhouse"; note tables 1 and 2) gases.
All of which is really just to reiterate one of my favorite student / concerned scientist / chatting-about-climate-with-the-skeptical talking points: our understanding of climate's relationship to greenhouse gases is very, very old. Tyndall was showing that "carbonic acid" (CO2) was opaque to infrared in 1862, alongside other such notable gases as NOx and "marsh gas" (methane). That a radical increase in the atmosphere's concentration of these *very* absorptive gases would lead to additional warming is about as elementary of a scientific postulate as can be.
10.31.2011
A picture is worth a thousand lives
 |
| Kristof's article |
From: Nicholas Kristof
Subject: the power of art
in september i traveled with bill gates to africa to look at his work fighting aids there. while setting the trip up, it emerged that his initial interest in giving pots of money to fight disease had arisen after he and melinda read a two-part series of articles i did on third world disease in January 1997. until then, their plan had been to give money mainly to get countries wired and full of computers.
bill and melinda recently reread those pieces, and said that it was the second piece in the series, about bad water and diarrhea killing millions of kids a year, that really got them thinking of public health. Great! I was really proud of this impact that my worldwide reporting and 3,500-word article had had. But then bill confessed that actually it wasn't the article itself that had grabbed him so much -- it was the graphic. It was just a two column, inside graphic, very simple, listing third world health problems and how many people they kill. but he remembered it after all those years and said that it was the single thing that got him redirected toward public health.
No graphic in human history has saved so many lives in africa and asia.
I'm sending you a copy of the story and graphic by interoffice mail. whoever did the graphic should take a bow.
nick kristof
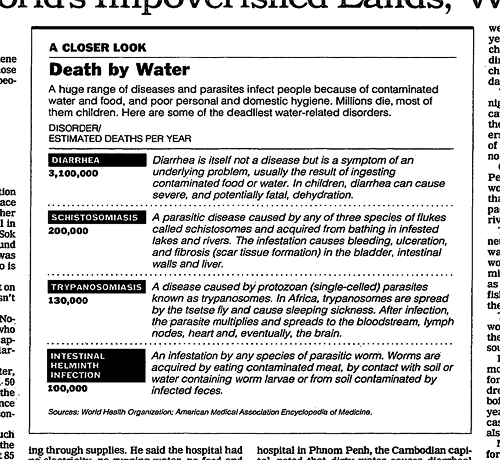 |
| The info-graphic/table that got Gates' attention. |
Apparently, the letter itself is framed and hanging up in the office of the data graphics group at the NYT. h/t Pam.
10.28.2011
Attributing climate records to climate change
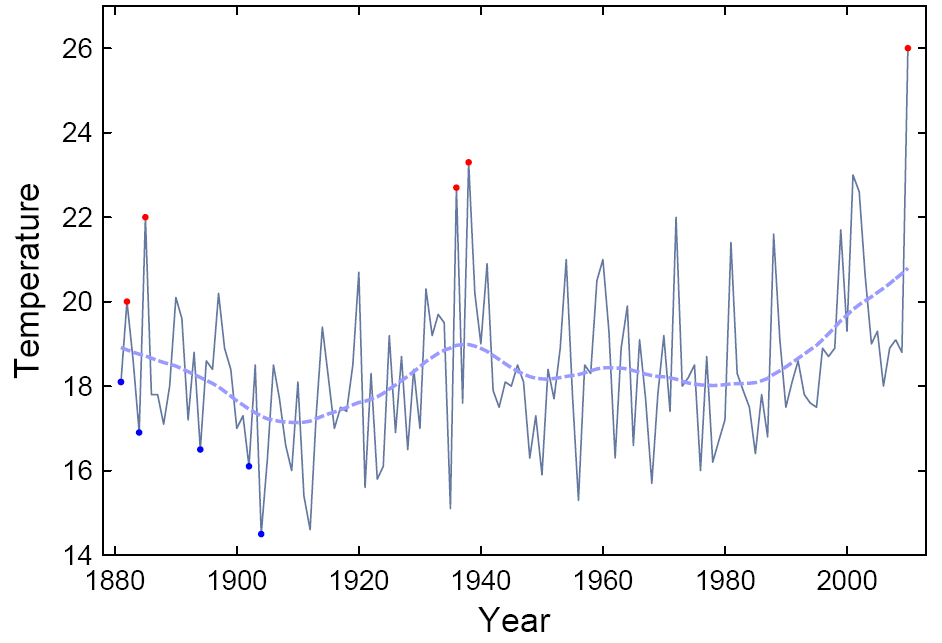
We develop a theoretical approach to quantify the effect of long-term trends on the expected number of extremes in generic time series, using analytical solutions and Monte Carlo simulations. We apply our method to study the effect of warming trends on heat records. We find that the number of record-breaking events increases approximately in proportion to the ratio of warming trend to short-term standard deviation. Short-term variability thus decreases the number of heat extremes, whereas a climatic warming increases it. For extremes exceeding a predefined threshold, the dependence on the warming trend is highly nonlinear. We further find that the sum of warm plus cold extremes increases with any climate change, whether warming or cooling. We estimate that climatic warming has increased the number of new global-mean temperature records expected in the last decade from 0.1 to 2.8. For July temperature in Moscow, we estimate that the local warming trend has increased the number of records expected in the past decade fivefold, which implies an approximate 80% probability that the 2010 July heat record would not have occurred without climate warming.I'm still mulling over how much I believe the causal claim here, but I really like the technique of modeling record-breaking as a function of the system's state over time. Some other potential applications immediately spring to mind...
10.27.2011
Expert credibility in climate change

Expert credibility in climate change
Although preliminary estimates from published literature and expert surveys suggest striking agreement among climate scientists on the tenets of anthropogenic climate change (ACC), the American public expresses substantial doubt about both the anthropogenic cause and the level of scientific agreement underpinning ACC. A broad analysis of the climate scientist community itself, the distribution of credibility of dissenting researchers relative to agreeing researchers, and the level of agreement among top climate experts has not been conducted and would inform future ACC discussions. Here, we use an extensive dataset of 1,372 climate researchers and their publication and citation data to show that (i) 97–98% of the climate researchers most actively publishing in the field surveyed here support the tenets of ACC outlined by the Intergovernmental Panel on Climate Change, and (ii) the relative climate expertise and scientific prominence of the researchers unconvinced of ACC are substantially below that of the convinced researchers.I particularly like the use of independent metrics to verify what my casual observation as a researcher says to be true.
Now, there's clearly potential endogeneity in this system since citation behavior can be strategic (e.g., this new paper in R.E. Stat), and many a scientific discovery has been waylaid by collusive behavior among scientists (see, for example, the rise and fall of radical mastectomies as detailed in Emperor of All Maladies, previously here). That said, the next time someone tells you there's a legitimate scientific debate over whether anthropogenic climate change is occurring, I think you can safely make a "we are the 98%" joke.
10.24.2011
Evidence of a link between migration and malaria
Alan Barreca, Price V. Fishback, and Shawn Kantor
Abstract: The Agricultural Adjustment Act (AAA) caused a population shift in the United States in the 1930s. Evaluating the effects of the AAA on the incidence of malaria can therefore offer important lessons regarding the broader consequences of demographic changes. Using a quasi-first difference model and a robust set of controls, we find a negative association between AAA expenditures and malaria death rates at the county level. Further, we find the AAA caused relatively low-income groups to migrate from counties with high-risk malaria ecologies. These results suggest that the AAA-induced migration played an important role in the reduction of malaria.


10.21.2011
Increasing income increases deforestation in Mexico
Over a year ago, I pointed readers to this paper after seeing it at WCERE and thinking it was important, so I'm happy to hear that its now forthcoming in ReStat. It is also is also an excellent example of individuals increasing their resource consumption, when they becoming richer, by increasing their trophic level (described two posts ago). The paper finds that when households receive cash transfers, they consume more meat, which requires more rangeland, which induces additional deforestation.
Jennifer Alix-Garcia, Craig McIntosh, Jarrod R. Welch, Katharine R. E. Sims
Abstract: We study the consequences of poverty alleviation programs for environmental degradation. We exploit the community-level eligibility discontinuity for a conditional cash transfer program in Mexico to identify the impacts of income increases on deforestation, and use the program’s initial randomized rollout to explore household responses. We find that additional income raises consumption of land-intensive goods and increases deforestation. The observed production response and deforestation increase are larger in communities with poor road infrastructure. This suggests that better access to markets disperses environmental harm and that the full effects of poverty alleviation can be observed only where poor infrastructure localizes them.

10.20.2011
Consensus building and norm engineering
The New York Times has a fascinating article on a recent radical decline in the prevalence of female genital cutting / mutilation in Senegal:
Across the continent, an estimated 92 million girls and women have undergone [genital cutting]. But like more than 5,000 other Senegalese villages, Sare Harouna has joined a growing movement to end the practice.
The change has not yet reached Ms. Kande’s new home in her husband’s village, but if elders there pressured her to cut the baby girl she is taking into the marriage, she said, “I would resist them.” Her parents back her up.
“They would never dare do that to my granddaughter, and we would never allow it,” said Ms. Kande’s mother, Marietou Diamank.
The movement to end genital cutting is spreading in Senegal at a quickening pace through the very ties of family and ethnicity that used to entrench it. And a practice once seen as an immutable part of a girl’s life in many ethnic groups and African nations is ebbing, though rarely at the pace or with the organized drive found in Senegal. ...
[H]ere in Senegal, Tostan, a group whose name means “breakthrough” in Wolof, Senegal’s dominant language, has had a major impact with an education program that seeks to build consensus, African-style, on the dangers of the practice, while being careful not to denounce it as barbaric as Western activists have been prone to do.The movement's success is heavily attributed to its inclusivity and consensus building, and the anecdotal evidence in the article seems to back it up. The fact that Tostan's strategy heavily involves griots, traditional story tellers who are somewhere between musician, MC, and radio personalities, seems particularly intuitive and appealing, a bit like trying to get celebrities and athletes in the US to speak out against smoking.
Along those lines, attributing of the program's success to having tailored itself to "African-style" consensus building seems rather small-minded. There are obviously many ways to get people to change their behavior (taxation, accolades, providing information ...), but abolishing genital mutilation seems to be a classic case of changing social norms, and when you think about it, a social norm is nothing more than a codification of expectations over the everyone's behavior. Changing a social norm involves shifting from one equilibrium state of expectations (everyone knows genital cutting is common and necessary and if my daughter doesn't undergo it she and my family will be judged) to another (everyone knows genital cutting is dangerous and unnecessary and if someone asks my daughter to do it they're crazy) for the entire group of individuals. It is, by definition, establishing a consensus.
I think we can thus say that Tostan's success (to the extent that the success is Tostan's and not attributable to larger demographic forces) lies less in exploiting some native preference for consensus that "Africans" have than in focusing efforts on small clusters of individuals with correlated norms (villages), and then propagating that norm change through the next-closest set of clusters (neighboring / inter-marrying villages). That Tostan works to convince those individuals in an inoffensive way (try convincing anyone, anywhere, to stop doing something because it's 'barbaric') seems necessary but not sufficient to effect that change.
10.19.2011
Innovation competitions
Jesse and I are working under a deadline, so our posts are suffering. Here are some links that might distract you from our inability to do two things at once.
Create a data visualization for global groundwater trends and have your work shown on the side of a building in Times Square.
A million dollar prize is awarded to a company for designing a more efficient oil skimmer. Video below.
Also, this is just plain amazing (from Jesse).
Create a data visualization for global groundwater trends and have your work shown on the side of a building in Times Square.
A million dollar prize is awarded to a company for designing a more efficient oil skimmer. Video below.
Also, this is just plain amazing (from Jesse).
10.14.2011
Trophic level as a measure of economic development?
I will return this this new Nature article in another post, since it brings up a lot of interesting points, but I think this ancillary point was worth highlighting (even though the authors don't make this case): Looking at where humans sit in the food chain might be a useful (or at least interesting) measure of economic development. In rich countries, land is used to feed animals that we eat. In poor countries, people eat a higher fraction of crops themselves. We've known about this phenomenon for a while now, but this map from the paper is striking because of its fully global perspective:
 |
| Here we show the fraction of the world’s total cropland that is dedicated to growing food crops (crops that are directly consumed by people) versus all other crop uses, including animal feed, fibre, bioenergy crops and other products. Averaged across the globe, 62% of total crop production (on a mass basis) is allocated to human food, 35% for animal feed (which produces human food indirectly, and less efficiently, as meat and dairy products) and 3% for bioenergy crops, seed, and other industrial products. There are striking disparities between regions that primarily grow crops for human consumption (such as Africa, South Asia, East Asia), and those that mainly produce crops for other uses (such as North America, Europe, Australia). Copyright: Nature |
10.13.2011
Valuing clean water in rural Kenya
My big sister spent a year in Malawi working on improving communal water infrastructure. She came home fed up because, among other things, it seemed like nobody was willing to pay for investments in their own infrastructure (if I recall correctly, the Clinton Foundation was trying to pay for the initial construction, but the communities weren't even willing to pay for the maintenance). I found this puzzling and wasn't sure I believed it at the time, but I guess I do now since the QJE says so. My big sister has really good intuition.
[This work suggests how public and private infrastructure can be compliments. Protection of public water sources isn't as effective (or highly valued, probably) when recontamination of water occurs in the home.]
SPRING CLEANING: RURAL WATER IMPACTS, VALUATION, AND PROPERTY RIGHTS INSTITUTIONS
MICHAEL KREMER, JESSICA LEINO, EDWARD MIGUEL, ALIX PETERSON ZWANE
Abstract: Using a randomized evaluation in Kenya, we measure health impacts of spring protection, an investment that improves source water quality. We also estimate households’ valuation of spring protection and simulate the welfare impacts of alternatives to the current system of common property rights in water, which limits incentives for private investment. Spring infrastructure investments reduce fecal contamination by 66%, but household water quality improves less, due to recontamination. Child diarrhea falls by one quarter. Travel-cost based revealed preference estimates of households’ valuations are much smaller than both stated preference valuations and health planners’ valuations, and are consistent with models in which the demand for health is highly income elastic. We estimate that private property norms would generate little additional investment while imposing large static costs due to above-marginal-cost pricing, private property would function better at higher income levels or under water scarcity, and alternative institutions could yield Pareto improvements.

[This work suggests how public and private infrastructure can be compliments. Protection of public water sources isn't as effective (or highly valued, probably) when recontamination of water occurs in the home.]
SPRING CLEANING: RURAL WATER IMPACTS, VALUATION, AND PROPERTY RIGHTS INSTITUTIONS
MICHAEL KREMER, JESSICA LEINO, EDWARD MIGUEL, ALIX PETERSON ZWANE
Abstract: Using a randomized evaluation in Kenya, we measure health impacts of spring protection, an investment that improves source water quality. We also estimate households’ valuation of spring protection and simulate the welfare impacts of alternatives to the current system of common property rights in water, which limits incentives for private investment. Spring infrastructure investments reduce fecal contamination by 66%, but household water quality improves less, due to recontamination. Child diarrhea falls by one quarter. Travel-cost based revealed preference estimates of households’ valuations are much smaller than both stated preference valuations and health planners’ valuations, and are consistent with models in which the demand for health is highly income elastic. We estimate that private property norms would generate little additional investment while imposing large static costs due to above-marginal-cost pricing, private property would function better at higher income levels or under water scarcity, and alternative institutions could yield Pareto improvements.

10.12.2011
Guide to the Nobel laureates in economics
The Nobel prize in economics* was awarded to the macroeconomists Thomas J. Sargent and Christopher A. Sims on Monday. Looking around for a bit of detail on their work I came across Tyler Cowen's annual round up of the Nobels over at Marginal Revolution:
There are also good profiles of both Sims and Sargent, including Cowen's trademark one sentence summary of the prize's implications (for Sargent: "Most of all, this is a prize about expectations, macroeconomics, and the theory and empirics of policy"; for Sims: "Basically this is a prize in praise of Minnesota macro, fresh water macro of course, and lots of econometrics.").
* or, officially, The Sveriges Riksbank Prize in Economic Sciences in Memory of Alfred Nobel. Wikipedia has (as usual) a good overview of how the economics prize differs from the rest of the Nobels (something I didn't even know before grad school).
Let’s go back to the Lucas Critique of 1976. Lucas looked at the large econometric models of the 1970s, models that contained hundreds of variables relating economic aggregates like income, consumption, unemployment and so forth. Lucas then asked whether these models could be used to predict the impact of new policies. One could certainly take the regression coefficients from these models and forecast but Lucas argued that such a method was invalid because the regression coefficients themselves would change with new policies.
If you wanted to understand the effects of a new policy you had to go deeper, you had to model the decision rules of individuals based on deep, invariant or “structural” factors, factors such as how people value labor and leisure, that would not change as policy changed and you had to include in your macro model another deep factor, expectations.
The Nobel for Christopher Sims and Thomas Sargent is for work each did in their quite different ways to develop ideas and techniques to address the Lucas Critique.
There are also good profiles of both Sims and Sargent, including Cowen's trademark one sentence summary of the prize's implications (for Sargent: "Most of all, this is a prize about expectations, macroeconomics, and the theory and empirics of policy"; for Sims: "Basically this is a prize in praise of Minnesota macro, fresh water macro of course, and lots of econometrics.").
* or, officially, The Sveriges Riksbank Prize in Economic Sciences in Memory of Alfred Nobel. Wikipedia has (as usual) a good overview of how the economics prize differs from the rest of the Nobels (something I didn't even know before grad school).
10.09.2011
More European worry, this time about science research
Science is Vital delivered a report at the request of the UK parliament regarding the state of scientific careers in the UK. It's not optimistic or surprising:
Executive Summary
Science is vital for the UK economy. A healthy scientific career structure, in turn, is crucial to maintain our strong research base, especially in a time of public austerity. Science is Vital, a grassroots campaigning group with the aim of protecting and championing science in the UK, recently conducted a consultation amongst a wide range of scientists in the UK to explore their views on the career structure of the profession.
Nearly 700 respondents, distributed across the spectrum of the scientific career, submitted written evidence – from students and postdocs to principal investigators, department heads, emeritus professors and Fellows of the Royal Society, representing more than 160 institutions across all four nations of the United Kingdom. We found that the top concern of these scientists was the career instability caused by successive fixed-term contracts and the shortage of permanent research positions. Other problems included issues of pay, mobility, balancing work with having a family or relationship, pressure to assess impact, and the fact that in many cases younger scientists are not allowed to facilitate their careers by applying for their own grants.
This exercise uncovered the widespread view that the scientific career structure in the UK is not fit for purpose. If the situation is not improved, we risk seriously undermining our research base and, in turn, imperilling the economy. Clearly, increasing funding for science in the next budget would significantly help ease the pressure. In the meantime, however, drawing from our respondents’ ideas, we have proposed a number of solutions that we would like to see discussed among government, scientists, funding bodies and universities, including:
(h/t to Andy Neal)
- The creation of more permanent research staff positions that are not principal investigators/lab heads
- More funding earmarked to help bridge the transition from postdoc to independent position
- More independent fellowships, and the abolition of eligibility criteria that effectively discriminate against older postdocs or those who have followed a non-traditional career path
- Increased opportunities for postdocs to apply for project grants as the named investigator in their own right
- The inclusion of early and mid-career researchers in ongoing discussions about the scientific career structure and funding issues
- Private sector contributions to scientific training
- Improved career advice for PhD students and postdocs
10.07.2011
Poverty and climate change are the "two most serious issues facing the world" according to Europeans
When Matt Kahn and Matt Kotchen showed that people seemed to worry less about the environment during bad economic times (at least according to their Google searches) some people got worried that during the current economic crisis, global environmental issues would take a back seat. But a recent report by Eurobarometer suggests that European concern about anthropogenic climate change continues to climb, in spite of the current economic situation. The Guardian reports
The Eurobarometer poll suggests that the majority of the public in the European Union consider global warming to be one of the world's most serious problems, with one-fifth saying it is the single most serious problem. Overall, respondents said climate change was the second most serious issue facing the world, after poverty.
Subscribe to:
Posts (Atom)