8.18.2011

The best research quote ever

 Theories have four stages of acceptance:
1. This is worthless nonsense;
2. This is interesting, but perverse;
3. This is true, but quite unimportant;
4. I always said so. 
-J.B.S. Haldane
Credit to this book, which I'll review when I finish it. More research quotes here.

8.16.2011

Paul Meier passes away

The New York Times and boingboing point out that Paul Meier, one of the first and loudest proponents of randomized trials in medicine, passed away last week. From his obituary:
As early as the mid-1950s, Dr. Meier was one of the first and most vocal proponents of what is called “randomization.”

Under the protocol, researchers randomly assign one group of patients to receive an experimental treatment and another to receive the standard treatment. In that way, the researchers try to avoid unintentionally skewing the results by choosing, for example, the healthier or younger patients to receive the new treatment.

If the number of subjects is large enough, the two groups will be the same in every respect except the treatment they receive. Such randomized controlled trials are considered the most rigorous way to conduct a study and the best way to gather convincing evidence of a treatment’s effects.
Before randomization, the science of clinical trials was imprecise. Researchers, for example, would give a new treatment to patients who they thought might benefit and compare the outcomes to those of previous patients who were not treated, a method that could introduce serious bias.
The article rightly focuses on Meier's influence in medicine, but the influence of the randomized trial on modern economics (and the applied social sciences in general) cannot be overstated. The observation that randomization lets one link correlation to causality as opposed to simple association is the basis of much of modern econometrics, and the framing and intellectual architecture built upon that insight has provided a host of very important results. Everything from Freakonomics' popularization of applied microeconomics to the ongoing row in the development community between the highly successful "randomistas" and their critics can be viewed as stemming from Meier and his allies' attempts to make medical research robust. While randomization clearly isn't everything, and even a well-identified research strategy must be subject to a host of caveats, if you're following this blog, doing applied work yourself, or just generally care about empirically determined (as opposed to theoretically justified) policy, you might want to raise a glass tonight to Meier and his legacy.

8.14.2011

Weather, stock market returns, and subtlety in causal inference

While hanging out with a few academic friends on Friday I began discussing a recent research paper with someone I didn't know particularly well. It turned out that this guy was the odd man out of the group and instead of being a professor / post doc / grad student he worked in finance, and was not terribly supportive of a lot of empirical work. Trotting out the classic "correlation doesn't imply causation" critique he then said something along the lines of "you could show that rain makes the stock market go up and down and it wouldn't mean anything." This of course reminded me of one of my favorite counterintuitive-but-compelling research literatures: the effects of weather on stock market returns.

Now, first off, it has to be said that one of the nice things about working with climate data and effects is that causality is, in fact, generally pretty easy to establish. While humans appear to be quite good at affecting climate at decadal time scales, we generally are unable to affect day-to-day or even month-to-month weather patterns, and have great difficulty predicting timing and spatial patterns of highly-relevant weather behavior such as heat waves and storms even over a time span of hours or days. While this is bad from a welfare point of view (e.g., we'd love to be able to predict where a hurricane will make landfall a month ahead of time) it means that statistical analyses of the impact of weather itself on a given phenomenon, provided you're careful about your research design, are generally pretty causally attributable. (see important caveat below)*

Given that, it turns out that there's some pretty strong evidence that weather affects stock market returns. There are multiple papers pointing out that stock market returns are affected by local weather (the latter of those containing this depressing gem of wisdom: "behavioral finance shows that lower temperature can lead to aggression, while higher temperature can lead to both apathy and aggression"). My favorite and, as far as I can tell from this literature, the definitive word on the subject so far, is this paper by Hirschleifer and Shumway showing that: yes, stock market returns are affected by the weather; the effect is driven by sunlight or the lack thereof and not precipitation per se; but the effects are so small that the only way to arbitrage across it is if you have absurdly low transaction costs (echoing one of my favorite applied finance papers of all time, Schleiffer's The Limits of Arbitrage).

If the sunlight result makes you think of SAD, or seasonal affective disorder, you're onto something interesting: Kamstra, Kramer and Levi find strong evidence (getting some nice identification off of solar insolation across hemispheres) that stock markets experience something like it, too. A follow up paper argues that one could capture the same result based just on hemisphere-appropriate seasonality and that an explicitly psychological 'SAD' effect is probably not supportable at present, though that finding was in turn disputed by Kamstra et al. Regardless, I'd argue that (a) seasonality driving markets is a fairly interesting idea, as is any result that links natural processes (which, after all, the seasons fundamentally are) and human behavior and (b) this only further impresses the necessity of the important caveat below.

All of which is to say that sometimes what seems at first glance to be a semi-ludicrous postulate can turn out to be quite true. Evidence has been found that stock markets are affected by everything from sports results to lunar phases, and in many cases these relationships seem both intuitive and robust. The question of what those results mean, however, can sometimes be difficult to tease out (have I mentioned the important caveat*?), so a policy proscription or a deeper insight into human nature might not actually be forthcoming. Put in other words, perhaps my finance friend was right: you can show that stock markets are affected by sunny days, but really, what does that mean?

* Important caveat: The fact that weather is exogenous doesn't mean that saying something about mechanisms / pathways / etc. is easy. Weather affects everything from crop production to labor supply to ecology and phenology to the stock market behaviors seen above, so if you're going to make a claim about weather affecting something *through* some pathway, or even more dangerously plan on using it as an instrument, you should be very, very careful. Economists call your justification for claiming causality in such cases your "exclusion restriction," and if there's one concept I'd like to see enter into the general population memosphere, it's that.

8.13.2011

Five years later, five myths about Africa

Scott Baldauf, Africa bureau chief of The Christian Science Monitor has a interesting and anecdote-rich piece from last week in which he lays out five common myths about Africa that keep coming up in his work. If you're feeling impatient, the five points are:
  1. Africa is 'poor'
  2. Africa is 'violent'
  3. Africa needs our help
  4. Africa is 'backward'
  5. Africa is a country
That he considers none of these to be true isn't necessarily surprising (the idea of Africa being a country is so commonly joked about that there's a major Africa blog titled "Africa is a country"), but it is a nice little summary of the difficulty of trying to "understand" an entire continent, and one that I largely agree with. Though let's not forget that even that is not an uncontroversial idea.

8.12.2011

Why you should care about aerobiology

Last week's Eos had an interesting article on aerobiology (pdf here).  The authors summarize some of the science behing the dispersal of single celled organisms via the air, then talk about the social implications of air-dispersal (eg. the spread of infectious diseases over large distances) and current advances in monitoring and modeling the process (this last bit is left out below, see the article if you're interested).

[Other recent Eos articles are here and here]
The High Life: Transport of Microbes in the AtmosphereBy David J. Smith, Dale W. Griffin & Daniel A. Jaffe 
Microbes (bacteria, fungi, algae, and viruses) are the most successful types of life on Earth because of their ability to adapt to new environments, reproduce quickly, and disperse globally. Dispersal occurs through a number of vectors, such as migrating ani- mals or the hydrological cycle, but trans- port by wind may be the most common way microbes spread. 
General awareness of airborne microbes predates the science of microbiology. Peo- ple took advantage of wild airborne yeasts to cultivate lighter, more desirable bread as far back as ancient Egypt by simply leaving a mixture of grain and liquids near an open window. In 1862, Louis Pasteur’s quest to dis- prove spontaneous generation resulted in the discovery that microbes were actually single-celled, living creatures, prevalent in the environment and easily killed with heat (pasteurization). His rudimentary experi- ments determined that any nutrient medium left open to the air would eventually teem with microbial life because of free-floating, colonizing cells. The same can happen in a kitchen: Opportunistic fungal and bacterial cells cause food items exposed to the air to eventually spoil. 
Unknowingly, Pasteur founded the field today referred to as aerobiology, the science that studies the diversity, influence, and survival of airborne microorganisms. Sci- entists now have the ability to monitor the movement of atmospheric microorganisms on a global scale. But long-term molecular- based measurements of microbe concen- trations are still missing—such information is needed to improve understanding of microbial ecology, the spread of disease, weather patterns, and atmospheric circulation models.

8.11.2011

Networks of the economic elite

In graph theory, the set of companies and their board members is a classic example of a bipartite graph: individual board members sit on the boards of different companies, "linking" them in an abstract sense.  Similarly, different board members are "linked" to one another by sitting on the same board of a specific company.
I recently ran across this very nice visualization of board members and companies for the United States. The visualization project is aptly titled "They Rule" and was purportedly built to improve political-economic transparency:
Overview
They Rule aims to provide a glimpse of some of the relationships of the US ruling class. It takes as its focus the boards of some of the most powerful U.S. companies, which share many of the same directors. Some individuals sit on 5, 6 or 7 of the top 1000 companies. It allows users to browse through these interlocking directories and run searches on the boards and companies. A user can save a map of connections complete with their annotations and email links to these maps to others. They Rule is a starting point for research about these powerful individuals and corporations.
Context 
A few companies control much of the economy and oligopolies exert control in nearly every sector of the economy. The people who head up these companies swap on and off the boards from one company to another, and in and out of government committees and positions. These people run the most powerful institutions on the planet, and we have almost no say in who they are. This is not a conspiracy, they are proud to rule, yet these connections of power are not always visible to the public eye.
The visualization uses the API of the data collection group littlesis.org, which is itself also worth checking out.  It seems like a data set ripe for network-based analysis of our country's political economic structure.

8.10.2011

What's causing the English riots?

Rioting in London has now spread to several other cities in England. After starting in Tottenham, North London (where 26 years ago the Broadwater Farm riots started) the riots are now in their 3rd or 4th day and have already resulted in multiple deaths and a huge amount of destruction. Notable losses thus far include a warehouse housing much of the English music and film industry's product stock, which many fear may bankrupt uninsured firms throughout the industry. So, what's causing the riots?

As always, it depends on what you mean by "cause." The proximate reason was the shooting death of unarmed father of four and / or alleged drug dealer Mark Duggan. The small but long-running empirical literature on riots reveals what I imagine most of us already suspect: these sort of events are common triggers but seem to serve a roll much more akin to catalyst than true cause. Much has been said in the mean time about the role of social media and easy cellular communication in advancing the riots, but much as Jared Cohen of Google Ideas said about the Arab revolts of this past year, it's hard to argue that either of those factors is really making a difference in whether the riots occur so much as simply helping rioters coordinate (for a particularly good write up of the role of social media in the riots, and the source of that Cohen Op-Ed, see this post at Gigaom).

So what's causing the riots and what can we learn from it? It obviously depends on the type of riot but a running theme is a simultaneous interaction between poverty, economic disparity, and political disenfranchisement. That's clearly not always the case, but this echoes a lot of what we know from the empirical literature on conflict, especially internal conflict. You're not likely to have a civil war if you have homogeneous social groups or an established political system respected by the public, and you're not likely to have riots if you have the same.

All of which is to say that riots generally seem to be very human expressions of discontent and powerlessness that are difficult to ascribe to purely thuggish motivations like a desire to loot. As more stories pour in ( "I saw 3 or 4 young women looting Tesco Express for nappies and milk tonight" "In Enfield most of those who gathered in the town centre were white. The youngest looked about 10-years-old" "No kids don't want to go to college no more coz they don't get paid") it's becoming clear that the English rioting seems to be driven by that same combustible mixture of poverty, inequality, and lack of options. Given that those factors seem to only worsening around the world, it seems wise to view the English riots not as a freak event but rather as part of a larger global trend.

8.09.2011

Follow the Hurricane Season

Artemis has a nice site for following the Atlantic's current storm season here.  The site even tabulates predictions from the various forecasting groups and has links to real-time satellite imagery.

The site features a viewer by stormpulse.com, which is worth checking out on its native site for a variety of interactive features (they also map Pacific storms other severe weather in the United States).  This data-visualization group may even be helping our government improve short-term policy: they've made it onto an LCD in the White House situation room for three years running.

8.06.2011

Temperature and worker output

Earlier this week I was at a small but excellent conference on adaptation to climate change, hosted at PERC in Bozeman (Michael Greenstone's keynote is covered here).  Lots of interesting results and ideas came up, but this was one of the most exciting outcomes for me.

Matt Neidell was presenting his working paper (joint with Josh Graff Zivin) on "Temperature and the Allocation of Time: Implications for Climate Change" when he put up this graph. It shows the number of minutes in a day that individuals (who work in outdoor or temperature-exposed sectors in the USA) spent working as a function of maximum temperature (in Fahrenheit) that day.  The interesting part of the graph is that on hot days, people work for less time.


Wolfram Schlenker then commented something like, "60 minutes out of an 8-hr work day? That's a huge effect!" And I thought "hmmm... 12.5% sounds familiar..." and then pulled up this graph from my own work on my computer.  The panel shows total output for similar sectors (in 28 countries, not including the USA) as a function of average daily temperature (in Celsius).  The graph shows that national output in several [non-agricultural] industries seemed to decline with temperature in a nonlinear way, declining more rapidly at very high daily temperatures.


Matt's graph uses micro-data from the American Time Use Survey combined with interpolated daily weather station data while mine uses total national production from UN national accounts combined with degree-day reconstructions from NCEP reanalysis, so they are completely different data sets utilizing completely different methods, but the results look extremely similar!  On hot days, output in non-agricultural sectors drops and workers work less.

Furthermore, not only do the shape of the response-functions look similar, but the magnitudes of the responses are similar (recall Wolfram's comment).  In Matt's graph, a day with maximum temperatures near 102.5 F (39.2 C) reduces time working by about 60 minutes (12.5% of an 8 hr day) relative to a day with maximum temperatures near 77.5 F (25.3 C).  In my graph, a day with average temperatures near 30.5 C reduces output to around 90% of what it would be relative to a day with average temperatures near 27 C.  Since daily average temperature is usually computed by averaging daily max and min temperatures, variations in average temperature should be approximately one half of variation in the max.  Using this rule to convert to common units, Matt and Josh found time worked fell by about 1.8% per 1 C in daily mean temperature [12.5%/((39.2 C-25.3 C)/2)] while I found that national output fell by about 2.9% per 1 C in daily mean temperature [10/(30.5-27)].  These numbers are not exactly identical, but they are certainly not statistically different give the uncertainty in both of our models.  In fact, I would say that they are extremely close given how different our techniques are.  To me, this feels like a research success.

It's worth noting that reductions in worker output have never been included in economic models of future warming (see here and here) despite the fact that experiments fifty years ago showed that temperature has a strong impact on worker output (see here and here).  In my dissertation I did some back-of-the-envelope estimates using the above numbers and found that productivity impacts alone might reduce per capita output by ~9% in 2080-2099 (in the absence of strong adaptation).  This cost excedes the combined cost of all other projected economic losses combined (eg. see here and here).

8.05.2011

Climate CoLab

Hannah Lee sent me this interesting project put together by the MIT Center for Collective Intelligence: the Climate CoLab.

What should we do about climate change?
Somehow we have to answer this question. You can help.
The Climate CoLab seeks to harness the collective intelligence of contributors from all over the world to address global climate change.
The Climate CoLab is a forum where teams create proposals for what to do in a series of annual contests.

The current contest is to respond to the prompt: "How should the 21st century economy evolve, bearing in mind the risks of climate change?"  I'm excited to learn what our collective intelligence has to say about this.

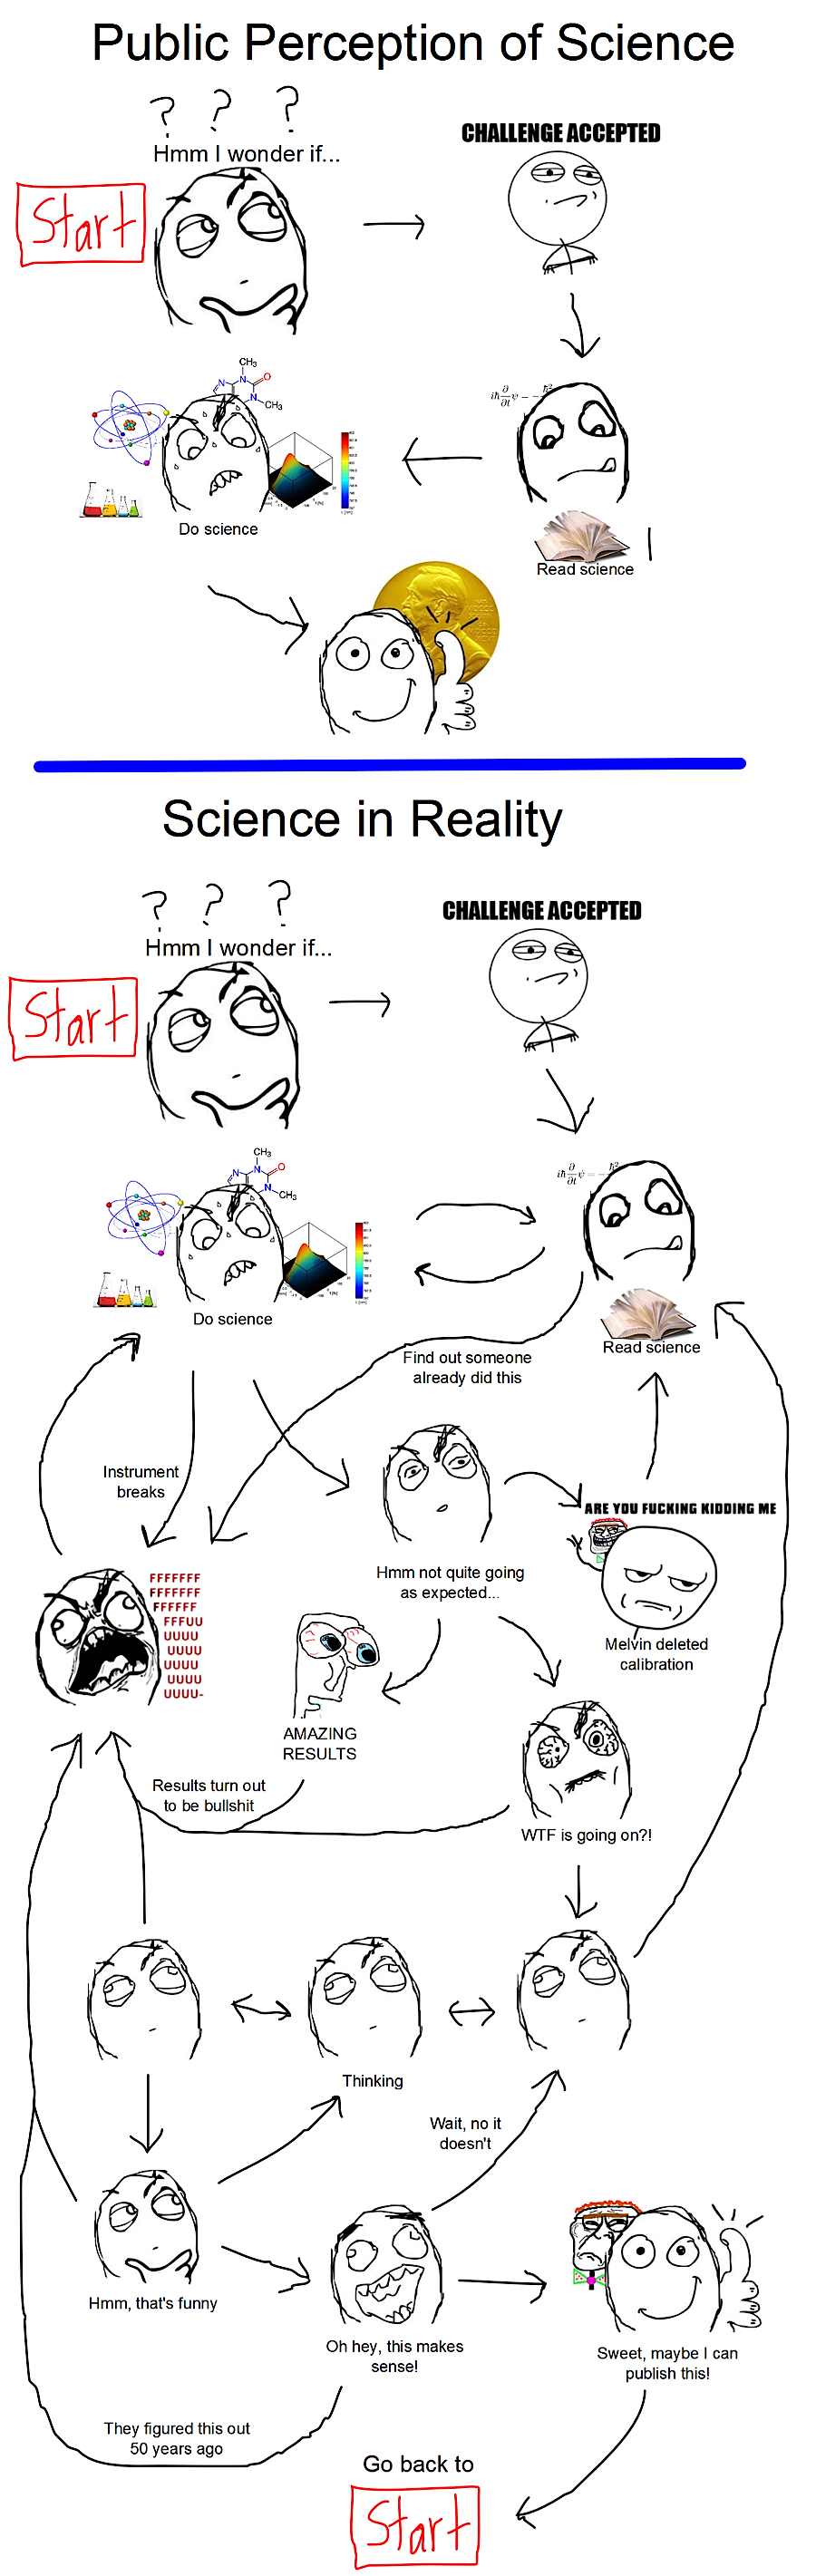
In unrelated but hilarious news, see this comic about doing science courtesy of Reed Walker. (If you're not an active researcher then this probably isn't funny to you, sorry.)

8.03.2011

The causal effect of going to my high school

An old high school friend* (crony?) sent me a Gothamist article linking to a new NBER paper by Abdulkadiroglu, Angrist, and Pathak on the causal effect of going to a New York City or Boston specialized public high school:
[...] We estimate the causal effect of exam school attendance using a regression-discontinuity design, reporting both parametric and non-parametric estimates. We also develop a procedure that addresses the potential for confounding in regression-discontinuity designs with multiple, closely-spaced admissions cutoffs. The outcomes studied here include scores on state standardized achievement tests, PSAT and SAT participation and scores, and AP scores. Our estimates show little effect of exam school offers on most students' achievement in most grades. We use two-stage least squares to convert reduced form estimates of the effects of exam school offers into estimates of peer and tracking effects, arguing that these appear to be unimportant in this context. On the other hand, a Boston exam school education seems to have a modest effect on high school English scores for minority applicants. A small group of 9th grade applicants also appears to do better on SAT Reasoning. These localized gains notwithstanding, the intense competition for exam school seats does not appear to be justified by improved learning for a broad set of students.
For the non-economists on this blog, Josh Angrist is one of the top empirical economists in the world (as well as enormously fun to read, viz my beach reading from last spring break) so having him evaluate your high school's academic outcomes is sort of like having John Madden come in and critique your JV football team.

As the authors openly admit in the paper, the experimental design (regression discontinuity, which was begging to be used to evaluate NYC specialized high school outcomes) is inherently limited in what it can say about students who were not near the cutoff. By assumption one treats students who barely make it into the school as being more or less the same as students who barely fail to make it in, and thus "going to the specialized high school" can be considered quasi-randomly assigned. Given that (and all of the tests that are run to make sure this assumption is valid) it looks like the simple act of going to a specialized high school when you're on the cusp is pretty nil. This may be surprising (and of course gets summarized in the Gothamist as "Stuyvesant, Bronx Science, Top Public Schools Not Worth It") but I think becomes less so with a little unpacking...

First, it's important to note that there's a very big difference between being in the bottom 10% at one school versus the top 10% at another. Kids who barely make it into a specialized high school are competing and comparing themselves against the remaining 90% of students who had little difficulty getting in. Meanwhile, their comparables at other schools are at the high end of the distribution. Given the complex nature of peer effects, teacher attention, and everything else, I'd say that these populations end up having very different experiences.

Second, I'd argue that a major reason specialized schools exist is not to help marginal kids do better but to allow superstar kids to do extraordinarily well. Stuy is famously referred to as a "haven for nerds" and like many top schools succeeds by virtue of giving driven and talented kids the opportunity and resources to do what they want. I imagine it'd be difficult to tease out (perhaps something geographic? I know a lot of kids from my neighborhood in the Bronx who went to Bronx Science despite getting into Stuy because it was much closer...) but I strongly suspect that the causal effect of going to the school is hugely nonlinear in ability.

Lastly, I'd say that even if we were to grant that the local treatment effect identified in the RD design reasonably proxied for the school's impact, test scores might not be the best place to look at outcomes. The specialized high schools are often touted as a means of leveling the playing field between poor (often immigrant) public school kids and rich private school ones. I suspect that if the outcomes of interest were not test scores but rather admission to elite colleges or wages in one's mid-20s, the results would be rather different.

In sum, the paper is super tightly identified, but given the populations they can plausibly claim to compare and the outcomes evaluated I'm not hugely surprised that the authors find little effect. My friends on Facebook and G+ who've been forwarding this to me can calm down. Unless they scored within 10% or so of the cutoff, in which case: sorry, guys, it was all for nothing...

* Full disclosure: I went to one of these schools (Stuyvesant) and *barely* made the cutoff, an experience that scared me into overperforming on standardized tests for the rest of my life.

8.02.2011

Infectious cancers, genotyping, and indirect extinction pressure

The cover story of last week's PNAS covers attempts by scientists to analyze the Tasmanian devil genome. The hope is that by doing so they might better understand the devils' vulnerability to the infectious cancer that's currently wiping them out at an alarming pace:
The Tasmanian devil (Sarcophilus harrisii) is threatened with extinction because of a contagious cancer known as Devil Facial Tumor Disease. The inability to mount an immune response and to reject these tumors might be caused by a lack of genetic diversity within a dwindling population. Here we report a whole-genome analysis of two animals originating from extreme northwest and southeast Tasmania, the maximal geographic spread, together with the genome from a tumor taken from one of them. A 3.3-Gb de novo assembly of the sequence data from two complementary next-generation sequencing platforms was used to identify 1 million polymorphic genomic positions, roughly one-quarter of the number observed between two genetically distant human genomes. Analysis of 14 complete mitochondrial genomes from current and museum specimens, as well as mitochondrial and nuclear SNP markers in 175 animals, suggests that the observed low genetic diversity in today's population preceded the Devil Facial Tumor Disease disease outbreak by at least 100 y. Using a genetically characterized breeding stock based on the genome sequence will enable preservation of the extant genetic diversity in future Tasmanian devil populations.
Devil facial tumor disease manifests itself in a fashion as horrific as one might guess, and is considered a major threat to the species' existence. Infectious cancers are more common outside of humans, though DFTD is still particularly odd: it isn't viral but rather consists of parasitic cells which spread from host to host via blood-to-blood contact. It's very similar to canine cancers with similar behavior and is believed to originate in a subtype of neural cell called Schwann cells (want to scare a friend? show them the title to the Schwann cell Science paper and underline "clonally transmissible cancer").

DFTD is interesting to think about above and beyond its clinical oddness for the fact that it seems to be largely our fault: humans likely introduced the cancer in the first place via dogs (an invasive species in Tasmania), and are doubly at fault for having reduced the devil population (the 100 year old dip in genetic diversity mentioned above) thereby reducing genetic variation and the potential for resistance. Short of a human intervention soon (researchers are apparently trying to figure out why a very small number of females are partly immune), the species will likely go extinct.

7.31.2011

Weak labor markets make army-building cheaper

It's generally accepted that civil conflict is more likely when a county's economic growth slows down (see here).  One hypothesis to explain this phenomena is that when economies perform poorly, soldiering becomes a relatively more appealing job and attracts individuals who might otherwise work elsewhere.  The argument goes that this makes it cheaper for opposition groups to build forces to fight an established government, thereby making conflict more likely.

In what seems like support for this idea (albeit in a different context), I heard this story reporting that these labor market dynamics appear to be obvious in the United States and are accepted wisdom at the Pentagon:
"A recession really does make recruiting less challenging than it otherwise would be," says Dr. Curtis Gilroy, who oversees active duty military recruiting nationwide. "We're in our third year in which all active duty services have achieved their numerical recruiting goals and either met or exceeded their recruit quality benchmarks as well." 
So the military gains not just more recruits, but better ones. Test scores are up along with the number of recruits who graduated high school. Today the military is letting in fewer recruits with waivers for minor criminal histories or past drug use. 
For all services, the quality of recruits is the highest it's been in nearly two decades. This, even as the nation is at war — and the risks of military service are as clear as ever.
Fraction of recruits graduating from high school,
 a measure of "recruit quality" used by the military.

7.29.2011

Forecasts of the Somali famine were ignored

I heard this interview by Neal Conan about the Somali famine today (transcript here).  The excerpt below caught my attention: apparently ENSO forecasts were used by people in the humanitarian agencies to predict declines in the food supply, but the early warning system was ignored by donors. [If anyone knows about this, I want to learn more about what happend.]
CONAN: The World Food Program aid is going to those [Kenyan refugee] camps. Is it getting into Somalia? 
QUIST-ARCTON: Oh, it arrived in Mogadishu today, the Somali capital, because apart from the Somalis who were fleeing the drought-hit areas into neighboring countries, as we said into Kenya and Ethiopia, many thousands are also heading towards Mogadishu, the capital, in search of food, shelter and medical care. And that is where the U.N. World Food Program has started sending food. 
It's also going to make similar deliveries, we're told, towards the Ethiopian border, hoping, of course, to get into the zones that have been declared famine areas. But many people are saying too little, too late. This drought was predicted up to two years ago. How come the global community has waited to the last minute, has waited, as usual, they say, until they see emaciated children in images flashed all over the world before they act? 
CONAN: The drought conditions are part of a cycle called La Nina. It's a reflection of the cycles of weather that come from the Pacific Ocean. And as you say, they were predicted two years ago. Do aid officials have any explanation when people say why didn't you have supplies here already? 
QUIST-ARCTON: Well, they say they have been talking about it. They sounded the alarm. There's an early warning system and that it's not just now that they have been talking about it. But they - they say they have a shortfall as we speak of one and a half billion dollars. 
Not only for the emergency. They say the problem is when it reaches this emergency stage, it costs a lot more than if people are fed where they are, in Somalia, before things reach crisis level. So the humanitarian agencies are saying, look, we did our part. We sounded the alarm. But you know, we need the response from the U.N. member states and others to help these people before things reach an emergency, which of course they have done.

7.28.2011

Reanalysis


People often ask me about using different climate data sources for social science research. Reanalyses.org is a new wiki site that will be a useful resource for people looking to use reanalysis data (see this RealClimate post for a short explanation of what reanalysis is and why this site is new/useful).


For social scientists looking at climate impacts, it's probably worth considering using reanalysis data.


First, if you work on problems in low income countries, there may be a relatively thin observational record in your region of interest (see here and here).  Using reanalysis helps interpolate between existing observations using a physical model, as opposed to using only statistical techniques. 

Second, the record of weather observations (again, particularly in low income countries) is influenced by social events (again, see here).  If you are a researcher concerned about endogeniety, this may be a serious issue.  For example, Vecchi and Knutson (2008) document the endogeneity of hurricane observations (and I can say with certainty that  endogenous weather observations influence climate impact estimates because I have a paper showing it).  My guess is that reanalyses can help mitigate this issue somewhat, since human observations are balanced against model estimates.  But, as Gavin and others have pointed out, reanalyses are still strongly influenced by the observational record so it is unlikely that using them can completely fix this issue.

7.27.2011

Hyperinflation and the birth of the real

NPR has a fascinating piece on how the Brazilian real (plural reais) was created in the early nineties to end hyperinflation. In short: it was originally a non-circulating, purely denominational currency meant to stabilize price expectations :
"We called it a Unit of Real Value — URV," Bacha says. "It was virtual; it didn't exist in fact."

People would still have and use the existing currency, the cruzeiro. But everything would be listed in URVs, the fake currency. Their wages would be listed in URVs. Taxes were in URVs. All prices were listed in URVs. And URVs were kept stable — what changed was how many cruzeiros each URV was worth.

Say, for example, that milk costs 1 URV. On a given day, 1 URV might be worth 10 cruzeiros. A month later, milk would still cost 1 URV. But that 1 URV might be worth 20 cruzeiros.

The idea was that people would start thinking in URVs — and stop expecting prices to always go up.

"We didn't understand what it was," says Maria Leopoldina Bierrenbach, a housewife from Sao Paulo. "I used to say it was a fantasy, because it was not real."
Yes, there are other ways of ending hyperinflation, but you have to say this one has its special charm.

7.26.2011

Arctic sea ice on track for a new record minimum

One of the research areas in which I work is how humans deal with new information about risk, especially climate risk. Thus I was very interested (and, of course, dismayed) to hear that we're currently on track for a record low in Arctic sea ice coverage.

The red line is us right now (2011) and note that it's currently tracking or exceeding the record minimum set in 2007. The decline in Arctic sea ice cover is widely considered to be one of the strongest pieces of evidence we have that we're dangerously altering the climate, though it also has its own more immediately concerning problems.

There's a discussion thread hosted by our friends at uber-climate blog Real Climate if you're so inclined, and a general-interest article about the decline and its relevance to non-climatologists on Andrew Freedman's Washington Post blog here.

7.23.2011

Earth Institute online stuff

See the EI blog "Vanishing Tropical Glaciers"
I recently had the pleasure of working with Kevin Krajick and David Funkhouser at the Earth Institute (EI) and they pointed me to some useful EI resources on how to effectively discuss science with the media.

Also an interesting find is the impressive blog of the EI: State of the Planet.  They have a steady stream of solid coverage for global events, general issues and ongoing research at the EI (for example, check out this sequence of posts about the Arctic Switchyard Project).

As Jesse always says, check it out.

7.22.2011

Some economics of digitized data

[this is a guest post by Kyle Meng]

We often pride ourselves for living in the age of information. The internet and its many services have made available to us a wealth of information and data with unprecedented ease of access. An important question, however, is whether we're gaining access to accurate information or the most useful information.

In a recent article published in Climatic Research (and reviewed HERE), researchers estimate that some 80% of all climate data collected has yet to be digitized. Much of this is data collected in the pre-industrial era, and some of it covering parts of the world we still don't know much about climatically (i.e. Africa). That's tremendously valuable information. When we think about anthropogenic climate change, one of the best ways to understand impacts in the future is to look to the past. The further back we can go, the more we can account for any natural variation in the Earth's climatic system and thus better understand how society respond to such changes. The social benefit is clearly there, and so too is the classic market failure.

So where is the private provision of this information? Let's take Google for example. Of all companies, Google, which tasks itself with cataloging and making accessible the world's information, seems the most likely candidate for digitizing climate information. Yet, if one looks at Google's efforts in digitizing information - from books to locations to artwork - its pretty clear that there's a profit motive (or more specifically an advertising motive) behind most of it. What would be the private returns of digitizing climate data? Zilch, unless you count the handful of academics that would use the data - but that's just a handful of adSense clicks from poor researchers.

Its a classic case for government funding. This is information that can potentially change the way we think about anthropogenic climate change. It's out there and yet there are few incentives or efforts to digitize it (with some notable exceptions). Of the deluge of information that's out there, shouldn't this rank higher than the latest celebrity tweet?

note: figure from Brohan P (2009) Why historical climate and weather observations matter? In: ACRE data and data visualisation meeting. Exeter Meeting, 15 September 2009. Available at: www.met-acre.org/meetings-and-workshops-1/acre-dataand-visualisation-meeting