8.28.2010

A new mechanism to consider when measuring climate impacts on economies

[A shorter (and more heavily copy-edited) version of this post was published in EARTH Magazine, read it here.]

My paper Temperatures and tropical cyclones strongly associated with economic production in the Caribbean and Central America was recently published in the Proceedings of the National Academy of Sciences. Because the paper is a little technical, here is a presentation of the results that everyone should be able to understand.

Following countries over time, years with higher than
normal temperatures during the hottest season 
(Sep-Oct-Nov) exhibit large reductions in output across  
several non-agricultural industries.
Central finding:
Economic output across a range of industries previous thought of as "not vulnerable to climate change" respond strongly to changes in temperature.  The data suggest that the response is driven by the direct human response to high temperatures: people generally are less productive and tire faster when it's hot.  This impact, which appears to be quite large, has not been factored into any previous estimates for the global cost of climate change.

Background
Governments and organizations around the world are trying to figure out how much money we should spend to avoid climate change.  The answer isn't obvious.  On the one hand, climate change seems ominous and we'd like to spend lots of money to avoid it. But on the other hand, if we spend money on avoiding climate change, we can't spend it on other important things. For example, imagine that the United Nations has a million dollars it can spend. Should it spend it on building solar panels or building schools?  Both are clearly important. But if we want to get the most "bang for our buck," we need to figure out what the benefits of these two types of investments are.

A whole research industry has sprung up around the cost-benefit analysis of preventing climate change.  How much money should be spent to prevent climate change by investing in more expensive low-carbon technologies? Who should pay for it and when should they pay for it?  A tremendous amount of intellectual machinery has been applied to this problem by many extremely smart people.  The basic approach is to build models of the world economy-climate system and try to see what happens to the climate and the economy under different global policies.  These models are used by governments around the world to determine what they think the best climate policies are and how much they should spend on the problem.

However, there is something of a dark secret to this approach: we don't really know what will happen to us if the climate changes.  We have a fairly good grasp of how much it might cost to implement different energy policies. And we've learned a lot about how different energy policies will translate into global climate changes.  But when it comes to figuring out how those climate changes translate into costs to society (both financial and non-monetary), we end up having to do a lot of guesswork.

It's unfair to say we know nothing about the costs of climate change, but what we understand well is limited to certain types of impacts.  For example, we have been doing extensive research on the possible agricultural impacts for years. We've also done studies for a lot of the health impacts.  But most research stops there.  For example, we only are beginning to learn about the effect of climate on people's recreation and perceived happiness.  We're also only beginning to learn about the effect of climate on violence and crime.  We know a lot (but not nearly everything) about the effect of climate on ecosystems, but we don't really understand how ecosystems affect us, so we still can't estimate this impact on society. The list goes on.

Now we know a lot about climate impacts on health and agriculture because people have studied those impacts a lot.  Why did we study those kinds of impacts so much? I'm not sure. Maybe because the importance of climate on health and agriculture is obvious (eg. my plants on the windowsill died after just two days of this summer's heat wave).

The fact that we only really understand agricultural and health impacts of climate change is very important in the cost benefit analyses I mentioned earlier.  When governments are trying to figure out the best policies, they add up the known costs of preventing climate change and they add up the known benefits of preventing climate change.   If the costs outweigh the benefits, then that suggests we shouldn't spend much money to stop climate change.  But there is a natural asymmetry in this comparison between costs and benefits: we know all (or most of) the costs but only know the health and agricultural benefits.  So when we add up the costs of energy policies, the numbers tend to look very big.  But when we add up the known benefits of those policies, we add up the health benefit and the agricultural benefits, but we have to stop there because we don't know what else will be affected by climate change.  Maybe it shouldn't be surprising that many cost-benefit analyses find that climate change is not worth spending a lot of money on.

But what we know about climate impacts in non-health and non-agricultural sectors is slowly improving.  In a 2009 working paper, Dell, Jones and Olken did something very simple and got very surprising results.  They compared the economic output of countries over time with year-to-year changes in the weather of those countries.  They found that in poor countries, small increases in the annual average temperature of a country lead to large drops in economic output of that country.  The approach sounds simple, right? It is.  But the results are startling because they found such a large effect of temperature. They estimate that a 1C increase in average temperatures decreases a poor country's gross domestic product (GDP) by 1.1% in the same year. To get a sense of how big this effect is, recall that the economy of the Unites States shrank by 2.4% in 2009 and people are upset about the state of the economy.

Because the effect found by Dell et al. is so large, many people have been skeptical that it represents something real (note from my own unpublished work: I can corroborate their results using different data sets from the ones they used).  To check these results further, in 2010, Jones and Olken tried to looking for a similar effect in the exports of these countries and found that they also responded strongly to temperature changes.  Do people believe the general result yet? I'm not sure.  But part the skepticism seems to persist because its hard to know why poor countries should be so strongly affected by temperature.  One reason for this is that it's very hard to know what mechanisms are at work when one is only looking at macro-economic data.  Further, thinking of ways in which temperature affects economics this strongly and systematically across countries seems to be hitting the limits of many peoples' imaginations. This is where my study comes in.

8.27.2010

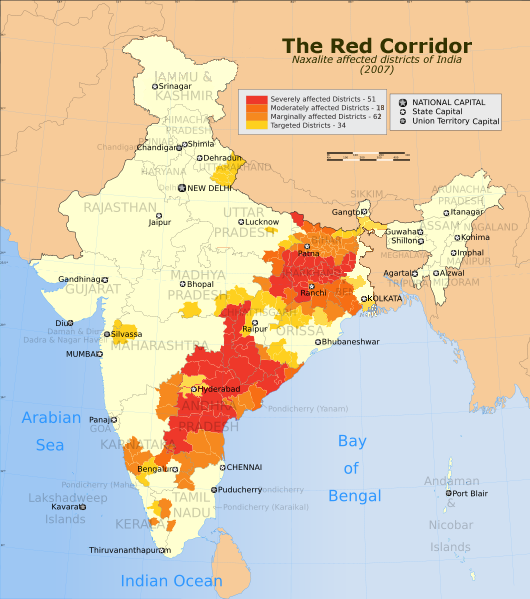
Quick Hit: Naxalites and India's Regional Resource Curse


Foreign Policy has a great article on the effect of mining (principally coal, but also iron and other metals) on two of India's poorest states, especially in fueling the ongoing Maoist / "Naxalite" rebellion. There's a couple of things that are pretty interesting in the article
  1. This is a pretty strictly regional "resource curse" dynamic. Normally one is taught to think of the resource curse operating on national levels (Dutch Disease, kleptocrat dictators, etc.) but it's interesting to see that that need not be the case. That made me appreciate how much the political economy and power dynamics in Appalachia are really just a developed-country, regional resource curse.
  2. Who knew India had that much coal? A classic "folk empirical result," if you will, of geographically-inclined development economists is that the countries which prospered during the industrial revolution had huge coal reserves. Not that China doesn't, too, but still: India? I clearly need to read more
  3. Calling the Maoist rebels "Naxalites" is apparently not accurate, which is interesting to hear since I've heard that term used by multiple people in the past few years.
  4. "If you want to be somebody in Jharkand, just kill an aid worker" manages to pack so much of the troubles of development work into so few words that it should count as haiku.
The article also has some great photography. Worth clicking through.

8.24.2010

Scalability and path dependency in urban planning


Providing a cogent reminder of the fact that scale matters in things like economics and urban planning just like it does in the natural world, a traffic jam between Jining and Beijing is now entering its 9th straight day of existence. Hat tip on that goes to Tyler Cowen at Marginal Revolution.

I lived in Beijing for the better part of a year after college and the traffic was awful even then. I remember one of the first things I heard about transport in the city was that the percent of urban area devoted to roads (or "road area ratio" in planning parlance) was vastly less than in other comparably-sized cities. Poking around a bit on Google Scholar yields a figure around 12% vs. cities like London being in the range of 35% and American commuter cities being in the range of 45% (Ge and Ping, 2008).

Abstracting a bit more, news like this makes me more sanguine about predictions that India and China are seeking to completely emulate American lifestyles, thereby placing an unbearable load on the Earth's resource base. If very deeply-rooted structural differences make owning personal vehicles this much of a pain this early in a country's development trajectory then I think the long-term prospects have to be fundamentally different. Recall that the Americas (ok, and Australia) were built more or less from scratch over the past two centuries while a lot of new transport and housing technologies were being developed and demographic changes were being realized. Expecting countries with longer histories and different cultural biases to have their pre-existing large cities turn into L.A. just because per capita incomes have gone up seems a bit simplistic.

Though I'm sure traffic in L.A. sometimes seems to last for days on end.

*Image copyright AP.

8.17.2010

timetric.com

A new website launched by a group in the UK makes accessing, analyzing and sharing time series data simple:

http://timetric.com/

Similar to gapminder.org, the target audience is the public.  The site is well put together, letting me make this graph and embed it in about a minute.


Data from Timetric.

To view this graph, please install Adobe Flash Player.


According to their About page:


timetric.com's full of indexes and indicators about nearly every part of your life and your business, from finance to weather to politics to sport. We're here to help you find the data you need, to use it and make sense of it, and to compare it with your own data. (The fancy name for this sort of thing is time series analysis).
We want to make your insights easy for you to share, so you can embed the indexes on timetric.com into your blogs and websites, or share them on Twitter, with just a couple of clicks.
And so you can compare your own data with the indexes we've collected, it's really easy to import your own data; you can upload Excel (or CSV) spreadsheets or enter it in by hand.
For the programmers out there, we've got an API, and we support all the good stuff like OAuthOpenID and OpenSearch, so it's easy to integrate Timetric with other services.
We're here to help you understand the world better, and to help you make better decisions through statistics, and we're just getting started.


I'm a big supporter of all these efforts to get data out into the public domain and accessible to everyone.  Its extremely difficult to get a sense of "the world" just looking at newspapers and other media, so making this kind of data accessible is another step in the right direction.

I've added the site to our Resources page.

8.11.2010

Geoengineering?

I was just on the website of EARTH Magazine (a magazine published by the American Geological Institute and whose target audience is the scientifically-inclined) and in the upper right corner was a simple online poll for visitors to click on.  The question and results are below.  I'm not even sure how I feel about geoengineering, but I find this simple graph fascinating.  


8.09.2010

Two and three-dimensional non-parametric regressions

A pet peeve of mine are people who run dozens of linear regressions but never check whether linearity  is a good assumption.  Often, people will run linear models and then look for non-linearities later.  But there's no point in estimating lots of linear models first if they might be meaningless.  For example, imagine a U-shaped curve of Y as a function of X.  In this case, estimating and declaring that a linear model estimates no relation between Y and X is not meaningful.  As a general rule, it's probably a better strategy to look for non-linearities early and often.

With the goal of searching-for-specifications in mind, its useful to have a method of non-parametric regression that's fast since the researcher will have to try many things. Locally weighted polynomial regressions are fairly slow, so the faster and simpler Nadaraya-Watson estimator (Nadaraya, 1964 and Watson, 1964) comes in handy.

My code for the NW estimator in Matlab is here.
(If your data is in Stata and you want to move it to Matlab, see my code for that here).

It contains 4 .m files. The file test.m will generate some random data and estimate the conditional mean with the NW estimator.  The code uses bootstrap-resampling to estimate confidence intervals. All models have flexible but fixed bandwidth.

With one dependent variable, NWbootstrap.m (with a normal kernel) and NWbootstrap_epkv.m (with an Epinechnikov kernel) are appropriate.

With two dependent variables,  NWbootstrap_epkv_3D.m is useful.  This should be used, for example, if you are looking for "interaction terms" in a multiple regression model (the slope of a function changes as a function of another variable).

UPDATE: A problem with dropping missing variables has been fixed.  The code drop_missing_Y is now in the NW toolbox to solve the problem.

All files have helpfiles with syntax. Below is a demonstration of the code.


7.29.2010

Revisiting Project Star and the Long-Term Impacts of Educational Interventions


Some big news in educational economics came out this week with a team of economists including Raj Chetty and Emmanuel Saez releasing some pretty groundbreaking results on the long-term impacts of Tennessee's Project Star. Slides from the talk where the results were presented are here. The New York Times has a pretty good overview here. Project Star is pretty well known in economics as it was one of the first big purposely randomized education experiments. Students were randomly placed in classes with different numbers of students to try and tease out whether class size had an effect on educational outcomes ("Star" pithily stands for "Student Teach Achievement Ratio"). It famously found that (a) effects were there in the intuitive sense, i.e., students in smaller classes did better on standardized exams, the metric of choice, but (b) those effects trailed off over time.

What Chetty, Saez and their coauthors do (which I think captures pretty nicely the sort of economics that sends a tingle of cleverness-excitement up my spine) is match students who were in the Star experiment with their tax records to get long term earning data. Two things are particularly cool about this. The first are the results themselves. They find that not only are class size effects important in the long run but teacher quality effects and (even more robustly) class quality effects have very measurable long-term impacts on latter life earnings and college attainment / achievement rates, even when those effects take place in kindergarten. If you want the terrifyingly strong result, check out slides 44 and 49 in the pdf. Moreover, they go back and show that test scores, which everyone agrees are only a proxy for what we actually care about, do a fairly nice job of predicting how people will do later on, providing some validity to programs that measure their impact by how well students do on exams. Whether that should be exciting or troubling is, I think, a pretty deep question.

The second thing that's cool about it is that it sets out to find long-term, indirect, but ultimately very important effects in a very picked-over area of research (Star has been written about a *lot*). The education literature has long been one of the main sources of new applied econometric technique, which is why someone like me whose research has very little to do with education knows about things like Tennessee Star or class size cutoffs in Israel. So the precedent this sets, which is basically "sometimes the effects we care about are 20 years down the line and not in the original area we were looking at" comes in a heavily trafficked area of research with both rich existing precedent and a lot of sway over other areas of applied research. Which obviously makes me happy, since that same precedent can be thought of as applying to a lot of the environmental, health, and public goods questions that we concern ourselves with in sustainable development-related research.

Anyway, if you have a second read the Times article or, even better, flip through the slides (they're pretty clean and approachable and have some great graphs). Then go teach a five year old something new.

7.25.2010

How we know what we know about the climate

Physics Today has a nice article this month on the history, development and contributions of the "A-train," a formation of satellites that orbit the planet and help us observe the climate system.  For non-experts, its a gentle and interesting introduction to many of the challenges associated with trying to observe and characterize the state of something as large and dynamic as, well... the entire world.

Without satellites, what we know about climate dynamics would be limited to what we can observe from the ground, balloons and airplanes.  While detailed measurements from the surface are essential to the science, they are expensive to collect and cannot tell us what is happening in locations far away.  Satellites, on the other hand, allow us to observe many locations rapidly at a cost that is lower than it would be if we tried to make all of those measurements from the ground.

The revolution that satellites offered us, in terms of understanding the dynamics of the planet we inhabit is often under-appreciated.  One might think that humans, inhabiting so many locations around the world, would somehow possess a single collective record of the daily temperature and daily rainfall everywhere. After all, how difficult is it to step outside with a thermometer and read it? Or to leave a bucket outside and check every day how much water fell into it?  It isn't terribly hard, but without the right institutional structure to provide funding, incentives to the observers and safe repositories for the data, it doesn't happen consistently.  A quick look at current weather stations in Central Africa compared to the Eastern Unite States compared to the Central Pacific confirms that our ground observations around the world are not of uniform density (or quality).

Here's an example of the challenges we face.  I study how changes in the environment, particularly the atmosphere, influence societies.  One question I've looked at is whether rainfall matters to the economies of the Caribbean and Central America.  To answer this question, what I'd like to do is to compare how economic outcomes (like profits in agriculture) respond to changes in rainfall. To do this, I tried to look at annual average rainfall over different countries over time.  But it turns out that getting this kind of data isn't trivial.

There are thirty-one countries south of Mexico and north of Colombia (each one is given a number on the y-axis in the figure at right).  But only about half of those countries regularly collected any rainfall data between 1950-1980.  In the figure, an open blue circle indicates that the country listed on the y-axis has at least one continuous record of rainfall for that year.  Not too many countries satisfy this criteria.  If I'm willing to work with data that's been processed a bit more, I could access statistically interpolated data that tries to use the existing station data to estimate rainfall in nearby countries.  Countries with complete records of interpolated data are given orange dots in the figure.  Notice that there's more estimated rainfall data, especially before the eighties when enough stations were collecting data to make useful estimates for the countries between stations.  But what happened between 1980 and 2000?  Why did the stations stop collecting data? And even worse, once enough stations stopped recording rainfall, the interpolated estimates become garbage, so the orange dots start to disappear too (note: the orange data stop in 2000 because of the data set, not because of data availability).  It would take a fair amount of detective work to figure out exactly why specific observations were missing, but a lot of social and political changes that might have contributed to the data scarcity were occurring in the 80's and 90's. For example, many of the countries in the region gained independence from European colonizers during that period.  If new young governments were less worried about maintaining unbroken records of rainfall than older colonial governments (which is often the case, and sometimes for good reason) than this could contribute to the breakdown of our station records.

Luckily, the early eighties were also the period when satellites first began taking regular observations of the atmosphere. And while satellite observations are never identical to surface observations, they are (1) often good enough and (2) always better than nothing.  Making the best of what we have,  gauge data, satellite data and numerical simulations can be combined to create longer, continuous and more consistent records of the environment.  The yellow dots above indicate that estimates of rainfall can be constructed using this combination of data sources.

We certainly don't know everything about these planetary scale systems, but sometimes its worth reflecting on the fact that we know anything at all.  Personally, I can't decide whether its more remarkable that someone organizes thousands of scientists around the world so that they all leave buckets outside to measure rainfall or that someone realized thirty years ago that thirty years later we would be so grateful to them for launching machines into space and leaving them there just watching for the weather.

7.20.2010

IPCC scholarship to advance climate-change education in vulnerable regions


The IPCC has announced a scholarship program funded by the money awarded to the organization for its 2007 Nobel Peace Prize:
The IPCC Scholarship Programme has been established with the funds received from the 2007 Nobel Peace Prize award to the IPCC. The first funding partner of the Programme is Dr. Gro Harlem Brundtland, Former Norwegian Prime Minister and UN Special Envoy on Climate Change.
The goal of this programme is to help strengthen the scientific and technical capability in developing countries to contribute to climate science and research and to develop and implement climate change policies and measures at the domestic and international level. It should aim to stimulate a sound knowledge base and institutional strengthening in developing countries. Priorities will include research on climate processes or the impacts of climate change in the most vulnerable regions of the world, the potential for adaptation and mitigation, and sustainable development....
The IPCC Scholarship Programme is targeting the most vulnerable regions of the world where the IPCC has identified gaps in knowledge in terms of climate change science and impacts. These comprise developing countries, and in particular Least Developed Countries and Small Island Developing States.
Therefore applications coming from scholars from these areas and addressing issues relevant to them will be given priority. The Scholarship provides for living expenses, and in some cases, for tuition fees as well.
The Programme aims at developing the knowledge, skills and capacity of the scholars in order to address climate change impacts and sustainable development. Priorities include research on the impacts of climate change in the most vulnerable regions of the world and the potential for adaptation, mitigation and sustainable development.
This seems like a sensible, ethical use of the award and a step in the right direction.  For many years I have argued that the technical knowledge needed to assess the costs or benefits of climate change (and related policies) are in short supply for many of the countries that need the expertise the most.  Colleagues who attended various international climate negotiations also consistently comment that the absence of technical experts, particularly in poorer (probably more vulnerable) countries negatively (and strongly) affects the bargaining power of many countries.  Even in the United States, it seems difficult to obtain the technical know-how necessary to formulate informed, comprehensive climate policies.  Perhaps other wealthy individuals/organizations will follow the lead of the IPCC and support the development of this kind of human capital.

7.14.2010

Displaying Matlab data in Google Earth

[ONE UPDATE AT BOTTOM]


It struck me the other day that Google Earth would be good platform for sharing my data with other people and found out that lots of people display their own data on the platform. Google even has a website to distribute Google Earth files that they like (this one, of the world population, was one of my favorites).  

So then I looked around to see if anyone had written code to help people convert Matlab data into Google Earth files.  The Google Earth Toolbox (recommended by my colleague Amir) worked great. It allows you to display data using functions very similar to standard Matlab functions (eg. imagesc()) only the output image is projected onto the planet and can be explored using Google Earth.  The image above is a map of the tropical cyclone climatology that I imported to Google Earth with only two lines of code. 

A = ge_imagesc(LON, LAT, flipud(DATA));
ge_output('FILENAME.kml', A);

[As indicated, the only bug I found was that some of the functions flipped the data vertically, which is easy to fix with one usage of the function flipud().]

It seems to me that one huge advantage of this presentation method is that pretty much anybody can view and explore global data-sets, since the interface is entirely intuitive and requires no manipulation (similar, in many respects to the contribution of Gapminder).

With a little extra work, I made the data-set dynamic in Google Earth, so that users can view data from different dates using a slider (see code below), and made this movie for use in presentations:


Below the fold is the script I used to make a Google Earth data set that changes over time.  Making the movie above required two additional steps.

  1. Add a "Tour" in Google Earth (under "Add") which just records your browsing of your data in a movie that plays back in the Google Earth Application.
  2. Use a screen capture program to record that movie as it plays back. (My friend Pam recommended this screen capture software, which works nicely and is easy to use). 
UPDATE:  SINCE I'VE REPEATED THIS PROCESS A FEW TIMES NOW, I'VE WRITTEN A FUNCTION IN MATLAB THAT GENERATES THE GOOGLE EARTH FILE.  ITS SIMILAR TO THE SCRIPT BELOW, BUT IS EASIER TO USE FOR AN ARBITRARY DATASET. DOWNLOAD IT HERE.

7.12.2010

Nature Climate Change announced

Today, the publishers of Nature announced that they will begin publishing a new journal titled "Nature Climate Change". 
Launching in April 2011, Nature Climate Change will be a monthly journal providing in-depth coverage of the impacts and wider implications of the Earth's changing climate.
A multidisciplinary journal, Nature Climate Change will publish high-quality research across both the natural and social sciences. The journal's mission will be to unify the body of research on the understanding, and impacts, of climate change as well as to place it in a wider social and political context.
This is extremely useful for those of us who are trying to work on climate change related problems but use a variety of methods from different disciplines.

Nature Climate Change will be a focal publication for the research community and for other parties interested in the implications of global and regional climate change, including natural and social scientists, policy makers, economists, governments and all other researchers on the periphery of climate change research....
Nature Climate Change will be a focal publication for the research community and for other parties interested in the implications of global and regional climate change, including natural and social scientists, policy makers, economists, governments and all other researchers on the periphery of climate change research.

7.08.2010

Panel finds East Anglia Climate Research Unit "scientific"

Another panel has found that the Climate Research Unit of East Anglia was not un-scientific in its work reconstructing historical surface temperatures.  The story and its background are here.
The new report is the last in a series of investigations of leading British and American climate researchers, prompted by the release of a cache of e-mail messages that cast doubt on their conduct and raised fresh public controversy over the science of global warming.
All five investigations have come down largely on the side of the climate researchers, rejecting a number of criticisms raised by global-warming skeptics. Still, mainstream climate science has not emerged from the turmoil unscathed.
The new report stated that “On the specific allegations made against the behavior of C.R.U. scientists, we find that their rigor and honesty as scientists are not in doubt.”

Quite amazingly, none of the standards of "truth" or "objectiveness" to which these and other climate scientists have been held are in any way applied to the members of the media, pundits or politicians who have made this kind of scientific research even more difficult to undertake.  I think most people would laugh if they imaged this kind of criticism applied to non-scientists, who are actually much more influential in shaping public opinion:
The latest report was by no means a complete vindication. Echoing the findings of an earlier report by a parliamentary committee in London, the reviewers criticized the scientists at the Climatic Research Unit for consistently “failing to display the proper degree of openness” in responding to demands for backup data and other information under Britain’s public-record laws.
As a scientist, I am frequently appalled at the types of things individuals can say on TV, with no accountability for whether their statements are true or not.  Forget about depositing data on public servers, I'd be happy if most people could even cite a single study that supported whatever claim they are making that day.

Even within the CRU drama, the double ethical standards have been upsetting.  Somehow, we've managed to forget that the email exchanges that started the debate were made public by a hacker. When China asks Google for some emails that it would like to use to indict its citizens, the American media explodes in anger.  But when a mysteriously anonymous hacker forcibly extracts emails from a private computer in an effort to discredit an honest scientist, we somehow don't even notice.  Even the NYT article seems to have exhonerated the hacker, carefully stating that
Embarrassing e-mail messages... were purloined from a computer at the university in November and posted to the Internet...
Note there is no use of the word "stolen" or "defamation".

Now that the validity of the science has been restored, we need to take steps to protect scientists.  It is unfathomably easy get public opion angry about technical scientific issues.  If we allow private individuals to act as intellectual vigilantes without any form of recourse when they are embarressingly wrong, it will become too easy and cheap to defame scientists when their findings are at odds with vested interest groups.  

To prevent such a situation from spiralling out of control, and hindering scientific inquiry, steps should be taken to prosecute those individuals responsible for this unnecessary drama.  I'm far from a legal expert, but I'm fairly certain that hacking, stealing emails and posting them online are sufficient evidence of malicious intent in something that should resemble a libel or defamation suit. While I am certainly angry about the fiasco, I don't think the hacker should be sued out of spite.  It is increadibly important that inaccurate and malicous attempts to discredit science be punished, otherwise there is no reason for people to not do it whenever it helps them to achieve some goal.

Biosphere Influences on Climate and Respect for Complexity


Photo source
Doing academic research involving climate means that every few times I tell someone what I do I get as a response some question to the effect of "So! What do you think about climate change?" I imagine Sol has similar experiences, and I think that responding to those inquiries in a way that manages to be informative, nontechnical, and contextual to what the person's heard before (even if it's counter to what I'm saying) isn't easy. I have a variety of different responses to this, but one thing I always like to emphasize is how complex the climate system is: over-forcing it the way we are now risks engendering potentially huge and baroque interaction effects that we won't anticipate until they are too late to reverse.

Two recent papers that highlight this issue in an interesting way came out recently in Nature and the Proceedings of the Royal Society B. The first, Smith, Elliot and Lyons' "Methane Emissions from Extinct Megafauna,"details an estimate of the net reduction in methane emissions that followed the (widely hypothesized as human-induced) extinction of large mammals in the Americas around 10,000BCE. They find that a large (they give between 12.5 and 100%) portion of the reduction in methane that we observe around that time period (a short period of global cooling known as the Younger Dryas) could be ascribed to the extinction of megafauna during this time period and the concomitant loss of their digestion-related methane emissions. This is important climatologically because methane is a very potent greenhouse gas, despite its relatively short residency time in the atmosphere, and thus big swings in it can be a major driver of short-term climate change.

The second paper, Boyce and Lee's "An exceptional role for flowering plant physiology in the expansion of tropical rainforests and biodiversity," estimates the effect that angiosperm (i.e., flowering) vegetation has on the climate, specifically on precipitation. Angiosperms have dramatically higher transpiration (evaporative loss through the plant, functionally the same as "plant sweat") rates than non-angiosperm plants and thus can contribute quite a bit to local precipitation, especially when heavily concentrated in areas like the Amazon rain forest. Boyce and Lee find that changing the flowering vegetative biomass in the Amazon from angiosperm to entirely non-angiosperm in a climate model would result in a huge decrease in precipitation, implying that such species are a major driver of the Amazon's extraordinarily high precipitation (which in turn drives a variety of other effects in the climate, as well as affecting rainforest biodiversity).

Now, obviously both of these are new papers and the extent to which the hypotheses they propose will stand up to scrutiny is still unknown. My personal interpretation is that the megafauna methane emissions paper, while intellectually pleasing, probably details a relatively minor part of the climate system while the angiosperm paper is pointing out a very interesting and fundamental part of biosphere-climate interactions. But both papers are nonetheless great examples of how complex the climate system is, and how even now we're still discovering fundamental drivers of climate variability. It's this complexity that should give us pause when we think about our current greenhouse gas emissions: if such a relatively minor (at least climatologically speaking) event as the extinction of some of the larger mammal species could potentially have led to or at least contributed to the Younger Dryas, then forcing the climate in so major a fashion as we currently are should definitely give us pause.

*Note: Image copyrighted L. Cunningham 2006.

7.07.2010

Haiti in "This American Life"

This American Life has an insightful (albeit depressing) story on some of the troubles facing economic development in Haiti.  Listen to it for free here.  I highly recommend it.

Some of the issues are related to the recent earthquake, some are not.

The statement that struck me the most was along the lines of (I'm paraphrasing):
"Haitian farmer X could get much better prices on her mangoes that she sells to the US if she took steps to prevent them from bruising. However, farmer X doesn't mind bruises on her mangoes, and she cannot even conceptualize an American consumer that is picky about bruises on her mangoes.  So farmer X does not take the simple, cheap steps prevent her mangoes from bruising."
I can't decide if I think this statement is true or not.  The idea that farmer X cannot imagine her consumer is important and interesting, but whether this information should be conveyed through price signals in her market does not seem obvious. Theory would predict that farmers should simply be offered higher prices for those mangoes she has that are less bruised, and thus she would learn that she can make more money if she doesn't let her mangoes bruise.  If this is not happening, why is that?  The inability to conceptualize her consumer does might explain why she is not proactive about preventing mango bruises before she is offered prices, but it doesn't explain why the price mechanism is failing in this instance.  Perhaps someone will do research on this problem so it can be effectively addressed.

Earthscan Sustainable Economics, Business and Policy books

I received this catalog in the mail and was surprised by the number and breadth of academic books on sustainability issues.  Several well known authors and many interesting topics.  I cannot vouch for the quality, but I will certainly browse the catalog and thought it was worth sharing.  The complete list of catalogs is here.  I've added it to the Meta-Resources page.

7.04.2010

Highlights from the World Congress of Environment and Resource Economics

This week was the Wold Congress of Environment and Resource Economics (WCERE) in Montreal, an event which happens only once every four years.  With 800 talks, I couldn't see most of them.  But below are titles, abstracts, links to papers and some of my thoughts on those talks that I found most interesting.  There's obviously sampling biases and my comments are based only on the talks, not the papers, so errors are not unlikely. In a future post, I'll include links to papers presented by students in the Columbia PhD program, which is why they are omitted below. To download the full working paper, follow the link to the WCERE site and click on the "download PDF" link on the right


INTER-ANNUAL WEATHER VARIATION AND CROP YIELDS 
Wolfram Schlenker, Columbia University 
Abstract: While the effects of rising mean temperatures on agricultural output have been studied extensively, there is limited discussion of the impact of inter-annual weather variation on crop yields. This paper estimates the link between weather and crop yields separating the influence of (i) mean weather outcomes (i.e., climate) to which a farmer can adapt from (ii) unpredictable year-to-year weather fluctuations to which a farmer can only partially adapt as crops are planted before the weather shock is realized. We find that corn in extreme climates, both hot and cold, are more sensitive to inter-annual weather variation than the ones in moderate climates. Global warming has two effects on corn yields: First, warming will induce farmers in moderate-temperate climates to plant varieties that are less robust to weather fluctuations, while farmers in cool climates will plant varieties that are more robust to weather fluctuations. Second, the elasticity of reductions in expected corn yields with respect to an increase in the standard deviation of weather fluctuations is -0.4. Since most farmers are eligible for subsidized crop insurance, an increase in weather variation also directly translates into added government payments.
Comments: One of this paper's nicest aspects is that it explicitly looks for the "micro" structure underlying aggregate production curves. We often assume there is a sequence of production functions for several crops, each of which has a different peak point along some dimension (here, temperature).  [For an example of this assumed structure, see the discussion in Deschenes and Greenston (AER, 2007); their working paper is here.] The usual assumption is that farmers who adapt to climate changes produce along the upper envelope of several overlapping production curves and are therefore less vulnerable to long term changes in temperature than they are to short term fluctuations.  This paper tries to test this assumption explicitly and finds that it holds up.  The other findings of the paper are nice, but to me, this seems like the most important contribution.


Trudy Ann Cameron, University of Oregon


Eric Duquette, University of Oregon

Climate change is expected to alter the spatial pattern, frequency, and severity of extreme weather events. These events will likely catalyze individuals‘ migration decisions as a means to reduce both direct and indirect weather-related risks to economic livelihood, life, and health. We analyze historical patterns of migration among U.S. counties in relation to varying spatial and temporal patterns in tornado activity and as a function of variables intended to capture the evolution of perceptions of these tornado risks. Our results provide an opportunity to understand migration based on extreme weather data that cover a long time-period, have a nationwide spatial extent, and include important economic factors that may constrain or enhance individuals‘ abilities to mitigate economic and health risks via migration. The broader goal of this research is to improve our understanding of how different types of households adapt to changing natural hazards. In particular, we are interested in the distributional consequences of climate change impacts of this type.


Comments: The data assimilation involved with this paper is impressive, so I bet they will produce more work using these tornadoes as instruments. The results are clean and somewhat larger than I would have expected.  However, I think the title and interpretation may not be appropriate, since it was not clear that they ever tested for impacts associated with the risk of events occurring, only the events themselves.

Martin Weitzman, Harvard
Abstract: A critical issue in climate-change economics is the specification of the so-called "damages function" and its interaction with the unknown uncertainty of catastrophic outcomes. This paper asks how much we might be misled by our economic assessment of climate change when we employ a conventional quadratic damages function and/or a thin-tailed probability distribution for extreme temperatures. The paper gives some numerical examples of the indirect value of various GHG concentration targets as insurance against catastrophic climate-change temperatures and damages. These numerical examples suggest that we might be underestimating considerably the welfare losses from uncertainty by using a quadratic damages function and/or a thin-tailed temperature distribution. In these examples, the primary reason for keeping GHG levels down is to insure against high-temperature catastrophic climate risks.

Comments: I think this is the most constructive of Weitzman's string of papers on catastrophic risk, perhaps because the final result (which is actually the absence of a result) doesn't rest on infinite negative losses.  I was most struck by his case that the quadratic loss function assumed by Nordhaus et al. is insufficiently flexible to express large aversions to catastrophic events.  I think this is an example of a seemingly innocuous, esoteric assumption made twenty years ago coming back to bite us later.

Jarrod Welch, University of California, San Diego
Jennifer Alix-Garcia, University of Wisconsin-Madison 
Craig McIntosh, University of California, San Diego 
Katharine Sims, Amherst College
Abstract: We study the consequences of poverty alleviation programs for environmental degradation in Mexico. We exploit the community-level eligibility discontinuity for Oportunidades (a conditional cash transfer program) to identify the impacts of income increases on local deforestation, and use random variation in the initial program phase to explore household responses. We find that additional income significantly increases demand for resource-intensive consumption goods. The corresponding production response increases deforestation but is localized only where communities have poor road infrastructure. The results suggest that better access to markets simply disperses environmental harm; the true impacts are only observable in infrastructure poor areas.
Comments: I really like what this paper is trying to do, the data they are willing to integrate and the importance of the findings.  It has all the makings of a great paper.  My only concern is whether the absence of deforestation in communities with high road densities is robust.  In general, its far harder to demonstrate a "null" result than to show that some sort of non-zero relationship exists, since failing to reject a null-hypothesis doesn't tell you much. I think that in order to make the claim described in the last two sentences of the abstract, they'll have to do substantially more work with the NDVI data they are using and/or look at data on trade or other markets.

Jeff Vincent, Duke University
Maximilian Auffhammer, University of California, Berkeley
Abstract: Recent research indicates that monsoon rainfall became less frequent but more intense in India during the latter half of the Twentieth Century, thus increasing the risk of drought and flood damage to the country’s rice crop. Our statistical analysis of state-level Indian data confirms that drought and extreme rainfall negatively affected rice yield during 1966-2002. Using Monte Carlo simulation, we find that yield would have been 2% higher on average if monsoon characteristics, especially drought frequency, had not changed since 1960. Yield would have received an additional boost of nearly 5% if two other meteorological changes (warmer nights, lower surface radiation) had not occurred. Climate change has evidently already negatively affected India’s hundreds of millions of rice producers and consumers.
Comments: I think their Monte Carlo method will become standard in the next few years. Its a nice way at getting at "climate" in comparison to "weather".

Maximilian Auffhammer, University of California, Berkeley
Brian Wright, UC Berkeley
Seung-Jick Yoo, Korea Energy Institute
Abstract: We identify two issues with a standard time series approach to reconstruction of past climate fluctuations from paleoclimatic data series, one related to specification of the estimated relationship between climate and the paleoclimatic index, the other to the methodology of estimation. We show that the standard approach provides biased estimates of the reconstructed climate series and underestimates the true variability of historical climate. We demonstrate that inversion of the estimated response function between tree ring growth and climate indicators provides consistent estimates of historical climate. The inversion method results in an overestimation of the variance. We show analytically as well as using Monte Carlo experiments and actual tree ring data, that use of the new specification and reconstruction procedure can be crucial for inferences about the nature of past climate and interpretation of recent climate variations.
Comments: I think this paper is going to have a big impact.  And I think the idea of having statisticians from different fields check one another's work is brilliant.  I hope this is implemented more in the future and I hope economists invite non-economists to check their math, so the exchange is bidirectional.

Matthew Neidell, Columbia University
Joshua Graff Zivin, UC San Diego
Abstract: In this paper we estimate the impacts of climate change on the allocation of time using econometric models that exploit plausibly exogenous variation in daily temperature over time within counties. We find large reductions in U.S. labor supply in industries with high exposure to climate and similarly large decreases in time allocated to outdoor leisure. We also find suggestive evidence of short-run adaptation through temporal substitutions and acclimatization. Given the industrial composition of the US, the net impacts on total employment are likely to be small, but significant changes in leisure time as well as large scale redistributions of income may be consequential. In developing countries, where the industrial base is more typically concentrated in climate-exposed industries and baseline temperatures are already warmer, employment impacts may be considerably larger.
Comments: Clean, simple and intuitive. I think there will be more work in this direction.  The only surprise is that in the twenty years since Schelling's armchair assessment, nobody thought of this.

6.20.2010

Iceland, Freedom of Expression, and Institutional Competition


Iceland's Althing* just passed a resolution that was being heavily pushed by Julian Assange, the founder of Wikileaks (and recently profile-ee of the New Yorker, here) that seeks to make Iceland's protection of freedom of expression, especially over the internet, the strongest in the world.

Now, there are multiple ways of thinking about why this was done (that it's an attempt to bring international accolades to a country that's been rather macroeconomically embarrassed of late doesn't seem out of the realm of possibility...) but what I find most interesting about is that it's yet another example of traditionally noneconomic things getting some very economic treatment. The language that's been used to cover the bill thus far has been quite evocative of another form of "institutional competition," namely tax havens. It's fairly conceptually similar to the way that places like the Caymans Islands have decided to give themselves comparative advantage among investors by setting low tax laws and regulations that encourage the creation and hassle-free maintenance of off shore investment vehicles.

Yes, there's a fundamental information asymmetry difference here in that freedom of expression is, by definition, observable, so unless they do it anonymously dissidents from other countries will only be protected from Iceland's laws, which is probably not what they're worrying about in the first place. That does make it a lot less attractive than the knowledge that I could dump some ill-gotten gains in a numbered account in Lichtenstein and never have it get found, taxed, or linked to my ill-getting, but nonetheless. The decision to institutionally compete is there, and I'm curious to see how it'll pan out and whether it'll have any material effect.

Now all we need is a greater degree of institutional differentiation and a reduction in migration barriers and we can get some megascale Tiebout sorting. Lower taxes for Russian-style restrictions on free speech, anyone?

* I feel like somewhere there's an undergrad viking mythology professor who's very happy I'm linking to the webpage of the oldest parliamentary institution in the world. And no, I can't read Icelandic. But Google Chrome does have Google Translate built in...