4.29.2011

May 6th-7th, 2011: Interdisciplinary Ph.D. Workshop in Sustainable Development

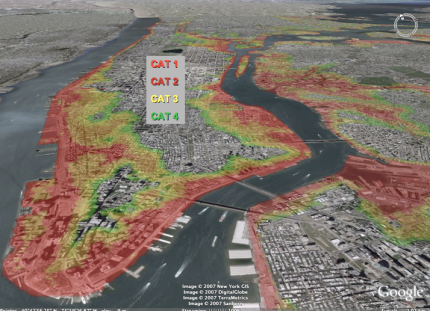
LICRICE model for the global
distribution of tropical cyclone winds
Event Announcement:

Interdisciplinary Ph.D. Workshop in Sustainable Development
May 6th-7th, 2011: Columbia University in the City of New York, USA

The Ph.D. students in Sustainable Development at Columbia University are convening the first Interdisciplinary Ph.D. Workshop in Sustainable Development (IPWSD); scheduled for May 6th-7th, 2011, at Columbia Universityin New York City.  The IPWSD is a conference open to graduate students (both Masters and Ph.D.) working on or interested in issues related to sustainable development.  It is intended to provide a forum to present and discuss research in an informal setting, as well as to meet and interact with similar graduate student researchers from other institutions.

The IPWSD schedule includes sessions by 35 speakers from institutions across the US, Europe and several other countries who will be giving talks on issues of sustainable development from a diverse range of disciplinary backgrounds, including economics, environmental science, engineering, psychology, sociology, law, and others. There will also be an introductory talk on Friday, May 6th,  by Professor Jeffrey Sachs, Director of the Earth Institute, and a panel discussion on "Climate Policy in the Face of a Catastrophe" with professor Scott Barrett, professor Mark Cane, and Andrew Revkin, editor of the "Dot Earth" blog for the New York Times.

For further details on the  Interdisciplinary Ph.D. Workshop in Sustainable Development (IPWSD) please refer to our:

Homepage: http://blogs.cuit.columbia.edu/sdds/schedule-events/ipwsd/

Program/Schedule: http://blogs.cuit.columbia.edu/sdds/schedule-events/ipwsd/program

To attend, please RSVP to: cu.sdds.ipwsd@gmail.com by Wednesday, May 4th.

4.25.2011

TRMM Satellite Data


Our colleague Amir points us to the great tropical precipitation data coming out of the Tropical Rainfall Measuring Mission Satellite. Lots of (tropical) rainfall and storm data, including for big events like cyclones, going back to 1998.

Also worth checking out, and going up on the student resources page shortly, is their very nice little Q&A on climate and weather, here.

4.23.2011

Mapping World Bank funds

Anisa found this one:  The World Bank has made data on all its projects available.  They've even made a nice GUI for exploring it all: maps.worldbank.org.


Click on a country and you can see descriptions of individual projects. 
Prior to the Spring Meetings 2011, Mapping for Results has identified more than 1250 active Bank financed activities working in 16,520 locations. These activities are a subset of more than 2,500 active financed Bank activities with a volume of more than $160 billion.

4.20.2011

Karlan and Appel's "More Than Good Intentions"


Dean Karlan and Jacob Appel's new book More Than Good Intentions (previously mentioned here) is coming out tomorrow and Sol and I got a hold of review copies. To that end, a review:

Overall it's a great read. Karlan does behavioral development economics with a big emphasis on Poverty Action Lab-style randomized control trials, and the book is essentially a thematicized overview of the current state of that field. What's particularly worth noting is that behavioral development econ is very new: most of the papers and studies covered are from the last ten years (Googling around a bit turns up what I think is the earliest lit review from 2006), and as far as I can tell this is the first book on the subject at all.

That newness shows up in the general slant of the book. A lot of general-audience econ and science books tend towards pithy summaries of major results from the author's area of research (e.g., "libertarian paternalism works" or "clever identification can reveal crazy facts"). But the pithy summary of this book would probably be something like "psychology really affects economic outcomes in developing contexts, sometimes hugely, and here's some promising early evidence." There's less a grand thesis that's being hammered away at so much as a constellation of interesting data points all hinting at a new and interesting way to think about the fundamental problems of development.

Some of those seem very promising. The multiple sections on microfinance provide a lot of worthwhile food for thought, and Karlan & Appel's emphasis on the importance of providing microsavings as opposed to simply microcredit is particularly welcome. Other parts of the book on areas like agriculture, health, etc. seem to me almost as if they should be "behavioral" chapters in books on those subjects, which really is another way of saying that the field is young and there's a lot of research waiting to be done.

In short, the book was fun, engaging, and a quick read, and in combination with some background texts could probably could sub out for a nice undergrad class on behavioral development economics. I'd especially recommend it to high school and college students who are interested in development and trying to get oriented in the field / find out who the major players are / figure out which open problems are juiciest.

4.19.2011

Kenneth Arrow on climate change and how times have changed

Sol and I had the good fortune to hear Kenneth Arrow speak last week. In addition to being one of the most famous economists ever (see Arrow-Debreu, Arrow's Impossibility Theorem, etc.) Arrow has a special place in our hearts because he spent part of his early career in climatology, specifically doing weather forecasting for the US military during World War II. Which leads us to my favorite quote from last week's seminar, which was really more of an aside:
"I was a meteorologist as my military service during World War II, and we were TAUGHT that carbon dioxide was going to make the world warmer."
Like I always say: the simple reason why CO2 warms the climate has been known for over 150 years. It was uncontroversial until it implied that we needed to change our lifestyles.

*Update: for more fun from Ken Arrow, see this Andrew Gelman's post on Arrow's Other Theorem ("any result can only be published at most five times").

4.16.2011

Even pirates need contracts

My advisor, Bentley MacLeod, has successfully convinced me that incomplete contracts are a central problem in both environment and development economics.  In both situations, there are a large number of complex phenomena that are difficult to specify in advance. This makes it difficult to write contracts describing future contingencies, leading to incomplete contracts and market failures.


I came across this story by NPR, a nice example of how important complete contracts are: Somali pirates are writing increasingly complex contracts with one another. Here are the highlights:
Ransoms now average between $4 million and $5 million, and researchers estimate as many as 2,000 pirates operate from Somalia's shores. 
Law enforcement sources say the larger pirate syndicates are becoming increasingly sophisticated and professional. Last year, the coast guard in the Seychelles, an island nation in the Indian Ocean, found an 11-page, handwritten piracy contract in a seized skiff. Like many business ventures, the contract outlined everything from division of profits to an employee code of conduct. 
I would love to know the rate of return for lending capital to pirates:
Wayne Miller, a former police officer from Australia, spent last year teaching the Seychelles' police how to interrogate pirates. Miller has seen the contract and said it divided ransom money into shares based on investors' contributions to the operation. 
"If they provided AK-47s or RPGs [rocket-propelled grenade launchers] or fuel, even the skiffs and mother ship, they were given a certain share that was quite high, and that ensured that whatever was made, the bulk would come back to them," Miller said.
 And don't forget your risk premium:
Miller said ransom shares for pirate workers were divided between those who did the more dangerous jobs — hijacking on the sea — and those who did the safer tasks on land. 
"Shares on land would relate to taking care of hostages once they were taken ashore," Miller said in an interview in Somaliland, an autonomous region of Somalia. "We noticed that the biggest share went to one particular person, and my assumption is that would be the negotiator." 
... or some basic institutions to ensure the rest of the rules are followed...
The contract even outlined a pirate code of conduct. Pirates could not fight and had to obey the captain's orders. If they broke the code, they forfeited shares. But the contract was not all stick. 
"What was striking were bonuses for being first on board another ship," said Miller.In fact, piracy researchers say the first on board can sometimes win a Toyota Land Cruiser.

4.11.2011

ARV recovery video

Sol and I are both reading Dean Karlan and Jacob Appel's new book More Than Good Intentions these days. It's on behavioral solutions to development problems, it covers a good deal of very current applied development economics, and we'll be throwing a review up on the blog shortly (thus far I've enjoyed it enormously).

In the meantime, though, I thought I'd link to what I think is a stellar example of just such a behavioral solution to a development problem, namely, this ad for anti-retroviral AIDS drugs:


How is that behavioral? Well, I think it's one thing to hear about the remarkable reversal of decline that ARVs bring about in otherwise-terminal AIDS patients. It's another thing to see it and identify with it. That may seem obvious, but Karlan and Appel's book is one of the first to discuss marketing in the context of development solutions. I think that's a lovely way, to piggyback on Sol's earlier post, to benchmark just how far development economics still has to go.

4.07.2011

Quick Hit: "The Long Island Express"


Since I mentioned it during my talk with the HSES students on Tuesday, I figured I'd very quickly point out one of the more interesting climatic disasters in New York City history: the 1938 "Long Island Express" hurricane. From the very lovely history site New York Traveler comes this excerpt from an account by 18-year-old Arthur D. Raynor of Westhampton:
If you had already been advised that Long Island was close to perfection on earth, that we had no worries about floods, earthquakes, hurricanes or other natural disasters that had befallen other unfortunate parts of the earth, the chances are pretty good that you could have gotten fooled on the 21st day of September, 1938.
Only a few months before, the local theater had shown a saga called “Typhoon,” and among the things I had gotten out of that was an observation by one of the characters in the movie that “the birds were acting peculiarly.” They were portrayed (how do you get a flock of wild birds to act?) as being excited, nervous, anxious and so forth. Not being an avid bird watcher, I couldn’t really tell if our birds were doing the same thing that day around lunch time, but it was close enough for me to mention it to my Grandmother, and her Mother, a visitor at the time. And you could have bet money on the reply. “One thing you never have to worry about on Long Island is floods, hurricanes, earthquakes and all those other things everybody not smart enough to live here worry about.”
The hurricane was a Category 3 on the Saffir-Simpson scale when it made landfall (after peaking at Cat 5 out to sea) and devastated much of eastern Long Island and the south New England coast. Wind damage in New York City wasn't extreme but flooding was (viz the photo above). Of course, this wasn't the only major hurricane to hit New York City; the 1893 Hog Island Hurricane, for example, is so named because it washed away most of Hog Island in between Long Island and Long Beach.

More generally, this is a tidy, local, little example of one of the fundamental problems with disasters, namely that we often generalize about dangerous events over a period of time (e.g., the lifespan of a high school student) much shorter than the average amount of time between those events. New York City seems from casual remembrance to be at no serious risk from hurricanes, but looking at past history indicates that we will surely get hit by a big one sometime sooner or later. And it's certainly better to accept that risk and prepare for it than otherwise.

Some more resources on the LIE Hurricane can be found here, and PBS actually has a documentary about it here.

4.05.2011

What empirical social science should aim for: lessons from physics

I frequently complain that empirical social science is obsessed with estimating parameters (eg. demand elasticities) that are rarely compared or generalized.  This makes it hard (or at least unreliable) to use empirical results in theory and prediction.

Recently, I ran into the paper Thermal Conductivity of the Elements: A Comprehensive Review (1974) by Ho, Powell and Liley (don't ask how). It seems like an excellent example of what we, as empirical social scientists, should be aiming for.

The paper is, as advertised, is a comprehensive review (circa 1974) of a specific class of basic physical parameters.  It takes parameter estimates from a huge number of lab studies and tries to synthesize what was known about a these basic parameters.  For a sense of how much research went into uncovering these basic parameters, the paper has 1626 references (this dwarfs anything I've ever seen in the Journal of Economic Literature).

I think that producing an analog of this figure (for essential variables) should be the "near-term" objective of empirical social scientists:

Click to enlarge

Each number denotes the results of a different study.  Note the dark black curve of "Recommended" values that can only be stated with confidence following such a meta-analysis.  How much work went into this single figure of a single parameter? The paper tabulates and summarizes every paper is uses, here's one of the pages the describes the studies from this figure. (The last entry on this page is numbered "190", but it's not the last page in the multi-page table.)

Click to enlarge
One thing that's so impressive about this review is that its not just about copper.  It has a similarly in-depth study of each element. For example, tungsten:

Click to enlarge

One thing that jumps out of this figure is the range of estimates produced by individual studies. Even in the laboratory sciences, it's hard to produce a perfect experiment.  If any one of the estimates above was taken as "perfect," it might produce a very distorted picture of reality.  In economics (the social science I know best), such experimental repetition is discouraged in favor of completely fresh (and clever) studies of novel phenomena. While this setup produces studies that are more entertaining in a seminar, I don't think these incentives are optimal for our science in the long-run.

Finally, its worth noting that it took a lot of hard work by many scientists to obtain the basic parameters pictured above (see the paper for many more).  In social science, where we didn't figure out how to reliably identify parameters in real or quasi-experiments until a few decades ago, we'll need to swallow our pride and recognize that we have a lot of catching up to do. (For example, note that Holland's paper popularizing Rubin's model was published in 1986, more than ten years after this review paper was published.)  I think that if we're honest with ourselves, most of the parameters in social science (besides, maybe, the wage returns to schooling...) are understood about as well as the thermal conductivity of erbium was in 1974.  Following Ho et al., most of our current parameter estimates should probably be explicitly termed "Provisional":

Click to enlarge

4.02.2011

What have we learned about oil prices? Not much.

[This is a guest post by Kyle Meng]

With recent rumblings of political unrest in the Middle East, concern about rising oil prices have returned to the headlines. None of this is new of course. 2005, our last episode of high oil prices, was only a few years ago. And of course, high oil prices triggered by political instability in the Middle East echoes the OPEC embargo of 1973 and the Iranian revolution of 1979. Even President Obama's recent call for energy independence appears like a deja-vu of Nixon's Project Independence in 1974. 

And as with before, many are wondering where oil prices are heading. Will it stay above $100 per barrel? Will we see some respite on the horizon? Unfortunately, it appears that our ability to answer these questions has also changed little over the last 30 years. Put simply, we just don't know. 


I recently came across this figure, assembled a few years back by Bill Hudson for a congressional testimony. The figure plots oil price forecasts made by the US Department of Energy made every year since 1982. Also shown is the actual spot price of oil. This analysis, presented each year in the DOE’s Annual Energy Outlook forecasts oil prices over the next 10-20 years. 

There are a few observations that jump out immediately. First, we’re really bad at making oil price forecasts in the long term (>5 years). For shorter horizons, our forecasts improve but only during periods of relative stable price movements (say the cheap oil price era of the late 1980s and 1990s). For periods of large swings, notably the early 1980s and mid 2000s, we seem to get everything wrong, regardless of time horizon. Interesting also are how the forecast biases change over time. Longer term forecasts in the 1980s and early 1990s seem to regularly overshoot the future price of all – all forecasts beyond 5 years seem to project that oil prices will increase, almost exponentially, into the horizon. This bias, perhaps a vestige of the 1970s oil shocks, diminishes overtime as forecasts “learn” to be less pessimistic, downplaying projected increases in future oil prices to the point that when the 2005 price spike occurs, the models are now too optimistic. In other words, we’re learning, but only to be told how wrong we are the next time a major event occurs. 

All this is interesting because forecasting is a regular part of the world we live in.  When an event occurs, we’re naturally inclined to wonder what will happen next. But that analysis is often difficult, particularly for systems as complex as global oil markets. Short run forecasts could always be made via a simple extrapolation of recent events but extrapolations do poorly against extreme events, which are the ones we typically care about anyways. As for the evens that do matter, unfortunately, we simply don’t have enough data to make good predictions, and so, time and time again, we’re taken by surprise.   

PhD. Student
School of International and Public Affairs
Columbia University

4.01.2011

Welcome Stuyvesant High School students!

So it looks like Fight Entropy is getting a few more special visitors these days. Welcome Stuy students! Sol and I have already set up a references and introduction page focused on climate change for your compatriots from the High School for Environmental Studies here. In the meantime, please feel free to comment on this post with any questions or requests for things you'd like me to cover when I meet with you all next week.

Stata's new geocode function

Our friend and colleague Reed Walker points out that there's a new Stata program called geocode that allows an internet-connected copy of Stata to query Google Maps for latitude and longitude. From Adam Ozimek at the excellent econ and general social science blog Modeled Behavior :
In the upcoming Stata Journal I have a paper with a coauthor that lets Stata query Google Maps in order to find latitude and longitude for addresses or other locations, also known as geocoding. What makes this useful is that you can have weird formatting, spelling errors, or missing information in your address or location variable and the program can still geocode it as well as Google Maps can place it on a map.
There's another program that calculates the "Google maps distance" (i.e., actual travel time distance as opposed to as-the-crow-flies geometric distance) between any two addresses. More details can be found here. This is very exciting.

3.31.2011

Two epic data contests

Two major and exciting data analysis contests were announced (relatively) recently and I thought I'd point our visitors to them:
  • The citations and papers megadatabase Mendeley has announced The Mendeley API Binary Battle, ending on August 31st of this year. The competition is open-form and basically just seeks to find someone who'll create an interesting and popular app that does something to "make science more open." Entries are judged (by, among other people, Tim O'Reilly and the CTOs of Amazon and Thomson-Reuters) on a combination of usage statistics, "viralness", "making science more open", and "coolness." The prize is $10,001, though I should point out that the runner up gets a Quadricopter.
  • The Heritage Health Prize launches April 4th and seeks to "develop a breakthrough algorithm that uses available patient data, including health records and claims data, to predict and prevent unnecessary hospitalizations." The contest uses high-quality anonymized actual patient data and is expected to run for about two years. The prize is $3 million.
The Netflix Prize is probably the most famous example of a data analysis competition, and apparently resulted in a rather large increase in the efficacy of Netflix's movie preference prediction algorithms. IBM Systems Magazine's blog has a rundown of data prizes in general here.

Personal accounts of climate-related conflict

MediaStorm produced for this nice video story for Yale's Environment 360 (there is a written discussion here as well).

For people like me who study climate-induced conflict with statistics and mathematical models, it's important to stay in touch with these personal stories of the people who suffer through these events.


As temperatures rise and water supplies dry up, semi-nomadic tribes along the Kenyan-Ethiopian border increasingly are coming into conflict with each other. When the Water Ends focuses on how worsening drought will pit groups and nations against one another. See the project at http://mediastorm.com/clients/when-the-water-ends-for-yale360

3.27.2011

Supplying Africa with climate data to fight disease

Climatic suitability for
malaria transmission.
See more here
In a Comment to Nature this week, M.C. Thomson et al. make the case that climatological information in Africa is under-supplied to decision-makers, especially in the management of public-health (read it here). They suggest that adequate climate information is in short supply because it is a public good, and the value it will generates is through the improvement of other public goods (such as sanitation).

"Climate information is not readily available, so is rarely incorporated into development decisions. At the same time, few public-health institutions or practitioners are equipped to understand or manage the effects of a changing climate, despite major advances in recent years in alerting the health community to its risks.
A dramatic improvement is needed in the availability of relevant and reliable climate data and services, particularly in Africa, where vulnerability to climate is so high. Information — such as historical observations of temperature, ten-day satellite estimates of rainfall, the predicted start date of the rainy season or the likelihood of extreme temperatures in the coming season — should inform the management of all diseases sensitive to climate. These include: malaria, leishmaniasis, acute respiratory infections, intestinal helminths and diarrhoeal diseases. This information could also contribute to food security by providing, for example, early warning for agricultural and livestock pests and diseases.
The following must be put in place within the next decade: new partnerships between the public-health community and national meteorological agencies, space agencies and researchers; a governance structure that ensures data sharing between public and private agencies; a funding model that builds open-access climate databases; climate scientists focused on the delivery of quality products, tailored to user needs; health professionals trained to demand and use climate information; and evidence of the value of all this, relative to alternative investments in health."
The authors use the example of Kericho, Kenya to make their point clear:
(Blue shading is the number of malaria cases per month)
SOURCES: REF. 7; G. D. SHANKS ET AL. GO.NATURE.COM/CPN7KD


"That it took a decade to establish a robust analysis of climate trends in Kericho, a focus of so much controversy, points to a broader disconnect between those who need climate information and those who produce it. In the 1980s, African meteorological agencies were encouraged to sell their data to raise revenue to maintain their networks of meteorological stations. The agencies' services have understandably prioritized their primary client, the airline industry. Access for non-commercial purposes, including for malaria research, has been constrained by poor collaboration and high data fees, among other factors. 
Instead, funding models are needed that recognize climate data as a resource for development — a classic public good that increases in value the more times the data are used." 

3.23.2011

ICPSR Social Science Data Repository

In a recent visit to the library (looking for old Haitian census data) a librarian helped me use the Inter-University Consortium for Political and Social Research data repository.  This group collects and curates a huge database of datasets and facilitates resource exchanges across universities (I used it to obtain hard copies of old censuses from Olin Library at Cornell). A link has been added to the Meta-Resources Page.

3.22.2011

Nature Climate Change Publishes first articles

Nature Climate Change is a new, high-profile and interdisciplinary journal focused on climate change research.  Its first research articles were released last week, abstracts below.


David B. Lobell, Marianne Bänziger, Cosmos Magorokosho & Bindiganavile Vivek

New approaches are needed to accelerate understanding of climate impacts on crop yields, particularly in tropical regions. Past studies have relied mainly on crop-simulation models or statistical analyses based on reported harvest data3, 4, each with considerable uncertainties and limited applicability to tropical systems. However, a wealth of historical crop-trial data exists in the tropics that has been previously untapped for climate research. Using a data set of more than 20,000 historical maize trials in Africa, combined with daily weather data, we show a nonlinear relationship between warming and yields. Each degree day spent above 30 °C reduced the final yield by 1% under optimal rain-fed conditions, and by 1.7% under drought conditions. These results are consistent with studies of temperate maize germplasm in other regions, and indicate the key role of moisture in maize’s ability to cope with heat. Roughly 65% of present maize-growing areas in Africa would experience yield losses for 1 °C of warming under optimal rain-fed management, with 100% of areas harmed by warming under drought conditions. The results indicate that data generated by international networks of crop experimenters represent a potential boon to research aimed at quantifying climate impacts and prioritizing adaptation responses, especially in regions such as Africa that are typically thought to be data-poor.


A. Spence, W. Poortinga, C. Butler & N. F. Pidgeon

One of the reasons that people may not take action to mitigate climate change is that they lack first-hand experience of its potential consequences. From this perspective, individuals who have direct experience of phenomena that may be linked to climate change would be more likely to be concerned by the issue and thus more inclined to undertake sustainable behaviours. So far, the evidence available to test this hypothesis is limited, and in part contradictory. Here we use national survey data collected from 1,822 individuals across the UK in 2010, to examine the links between direct flooding experience, perceptions of climate change and preparedness to reduce energy use. We show that those who report experience of flooding express more concern over climate change, see it as less uncertain and feel more confident that their actions will have an effect on climate change. Importantly, these perceptual differences also translate into a greater willingness to save energy to mitigate climate change. Highlighting links between local weather events and climate change is therefore likely to be a useful strategy for increasing concern and action.

3.16.2011

Social Conflict in Africa Database

The University of Texas at Austin has put together a new dataset to support conflict research in Africa. Some nice features of this dataset are that they code many types of conflict, not just civil wars, and that the conflicts have "issues" associated with them (eg. "democracy" or "environmental degradation"). The database is searchable and downloadable, and the website has some nice discussions of ongoing research projects.
The Social Conflict in Africa Database (SCAD) is designed to provide users with a comprehensive, methodologically rigorous resource for analyzing social conflict events across the African continent, including all countries with a population of more than 1 million.  It compiles events reported by the Associated Press and Agence France Presse from 1990-2009.  SCAD is designed for use by academic researchers, as well as by journalists, non-governmental organizations, policy makers, and others interested in African politics.

Each record in SCAD refers to a unique social conflict event.  To define an event, the researchers determined the principal actor(s) involved, the target(s), as well as the issues at stake.  Events can last a single day or several months.  A conflict is coded as a single event if the actors, targets, and issues are the same and if there is a distinct, continuous series of actions over time.
Some interesting plots from the website:


Sustainable Development Articles

Our colleague James Rising points us to his newly coded up creation Sustainable Development Articles:
I put together a site for collecting Sustainable Development papers and articles! This is for all of us who wish there were a better way to find, share, and keep track of good SD reading material.
[...]

If you use Mendeley [previously blogged on FE here] for organizing your papers, you can drag-and-drop papers into the site by joining the Mendeley group "Sustainable Development to sd.existencia.org Bridge" and putting the papers there. With a delay (~ 1 hr), they'll show up on the site!
There's already a bunch of great stuff up there. Go take a look.