Showing posts with label weather. Show all posts

6.03.2013

Weather and Climate Data: a Guide for Economists

Now posted as an NBER working paper (it should be out in REEP this summer):

Using Weather Data and Climate Model Output in Economic Analyses of Climate Change
Maximilian Auffhammer, Solomon M. Hsiang, Wolfram Schlenker, Adam Sobel
Abstract: Economists are increasingly using weather data and climate model output in analyses of the economic impacts of climate change. This article introduces weather data sets and climate models that are frequently used, discusses the most common mistakes economists make in using these products, and identifies ways to avoid these pitfalls. We first provide an introduction to weather data, including a summary of the types of datasets available, and then discuss five common pitfalls that empirical researchers should be aware of when using historical weather data as explanatory variables in econometric applications. We then provide a brief overview of climate models and discuss two common and significant errors often made by economists when climate model output is used to simulate the future impacts of climate change on an economic outcome of interest.

5.09.2012

AGU Science Policy Recap


Last week I had the pleasure of attending the first AGU Science Policy Conference in DC. One of the things I like the most about AGU events is the wide variety of academic fields from which attendees are drawn, and even given the comparatively narrow focus of this conference (there were only about twenty sessions, compared to the AGU annual meetings's thousands) the number of interesting ideas and novel concepts afloat was overwhelming. Below the fold are selected highlights, notes, and interesting errata from the two days I was there...

4.04.2012

US Wind Fields Visualization

Following last week's ocean currents animation one of our readers sends us Fernanda Viégas and Martin Wattenberg's real time Wind Map:

The wind map is a personal art project, not associated with any company. We've done our best to make this as accurate as possible, but can't make any guarantees about the correctness of the data or our software. Please do not use the map or its data to fly a plane, sail a boat, or fight wildfires...
Surface wind data comes from the National Digital Forecast Database. These are near-term forecasts, revised once per hour. So what you're seeing is a living portrait. (See the NDFD site for precise details; our timestamp shows time of download.) And for those of you chasing top wind speed, note that maximum speed may occur over lakes or just offshore. 
We'd be interested in displaying data for other areas; if you know of a source of detailed live wind data for other regions, or the entire globe, please let us know

3.12.2012

Can rainfall explain a HUGE fraction of economic underperformance in Africa since 1980?!

Somehow I missed this when it came out. Review of Economics and Statistics, 2010:

TRENDS IN RAINFALL AND ECONOMIC GROWTH IN AFRICA: A NEGLECTED CAUSE OF THE AFRICAN GROWTH TRAGEDY

Salvador Barrios, Luisito Bertinelli, and Eric Strobl
(earlier working paper here)

Abstract: We examine the role of rainfall trends in poor growth perfor- mance of sub-Saharan African nations relative to other developing coun- tries, using a new cross-country panel climatic data set in an empirical economic growth framework. Our results show that rainfall has been a significant determinant of poor economic growth for African nations but not for other countries. Depending on the benchmark measure of potential rainfall, we estimate that the direct impact under the scenario of no decline in rainfall would have resulted in a reduction of between around 15% and 40% of today’s gap in African GDP per capita relative to the rest of the developing world.


Click to see simulation results.

1.30.2012

Postcards from the Anthropocene: Pollution's impact on tornadoes

Daniel Rosenfeld and Thomas L. Bell have a new paper out in the Journal of Geophysical Research arguing that the weekly cycle of aerosol pollutants resulting from human activity is likely to blame for the similarly-timed weekly cycle in tornado activity (h/t Luke):
Why do tornados and hailstorms rest on weekends?
This study shows for the first time statistical evidence that when anthropogenic aerosols over the eastern United States during summertime are at their weekly mid-week peak, tornado and hailstorm activity there is also near its weekly maximum. The weekly cycle in summertime storm activity for 1995–2009 was found to be statistically significant and unlikely to be due to natural variability. It correlates well with previously observed weekly cycles of other measures of storm activity. The pattern of variability supports the hypothesis that air pollution aerosols invigorate deep convective clouds in a moist, unstable atmosphere, to the extent of inducing production of large hailstones and tornados. This is caused by the effect of aerosols on cloud drop nucleation, making cloud drops smaller and hydrometeors larger. According to simulations, the larger ice hydrometeors contribute to more hail. The reduced evaporation from the larger hydrometeors produces weaker cold pools. Simulations have shown that too cold and fast-expanding pools inhibit the formation of tornados. The statistical observations suggest that this might be the mechanism by which the weekly modulation in pollution aerosols is causing the weekly cycle in severe convective storms during summer over the eastern United States. Although we focus here on the role of aerosols, they are not a primary atmospheric driver of tornados and hailstorms but rather modulate them in certain conditions. 
For a general audience article check out the write up at National Geographic, here. Of relevance is a variety of prior work on weekly weather cycles such as this paper in Nature and this paper also by Dr. Bell.

Note the graph showing weekly cycles of tornadoes, hail storms, and PMs 10 and 2.5. I think someone just violated a whole bunch of exclusion restrictions...


11.24.2011

Math studying = f(weather)

At MIT we used to joke that the earth science department turned on the "weather machine" on the days when prospective students were visiting and trying to decide whether to enroll (since the weather always seemed to be perfect).  But maybe the admissions department got a sign mixed up when then told EAPS what kind of weather they wanted.

More seriously, this may be important for explaining labor supply responses to the weather.

Weather to go to college
Uri Simonsohn

Abstract: Does current utility bias predictions of future utility for high stakes decisions? Here I provide field evidence consistent with such Projection Bias in one of life’s most thought-about decisions: college enrolment. After arguing and documenting with survey evidence that cloudiness increases the appeal of academic activities, I analyse the enrolment decisions of 1,284 prospective students who visited a university known for its academic strengths and recreational weaknesses. Consistent with the notion that current weather conditions influence decisions about future academic activities, I find that an increase in cloudcover of one standard deviation on the day of the visit is associated with an increase in the probability of enrolment of 9 percentage points.


11.16.2011

We should rename this the Temperature Blog

When I first showed these results to people, more than one of my senior colleagues said "It can't be true, you made a mistake."  But now that business faculty are working on the problem, I might be willing to declare that we have reached stage two of acceptance.

Severe Weather and Automobile Assembly Productivity

Gérard P. Cachon, Santiago Gallino and Marcelo Olivares


Abstract: It is expected that climate change could lead to an increased frequency of severe weather. In turn, severe weather intuitively should hamper the productivity of work that occurs outside. But what is the effect of rain, snow, fog, heat and wind on work that occurs indoors, such as the production of automobiles? Using weekly production data from 64 automobile plants in the United States over a ten-year period, we find that adverse weather conditions lead to a significant reduction in production. For example, one additional day of high wind advisory by the National Weather Service (i.e., maximum winds generally in excess of 44 miles per hour) reduces production by 26%, which is comparable in order of magnitude to the estimated productivity drop during the launch of a new vehicle. Furthermore, the location with the best weather (Arlington, Texas) only loses 2% of production per year due to the weather, whereas the location with the most adverse weather (Lordstown, OH) suffers an annual production loss of 11%. Our findings are useful both for assessing the potential aggregate productivity shock associated with inclement weather as well as guiding managers on where to locate a new production facility - in addition to the traditional factors considered in plant location (e.g., labor costs, local regulations, proximity to customers, access to suppliers), we add the prevalence of bad weather.


Welfare Costs of Long-Run Temperature Shifts
Ravi Bansal, Marcelo Ochoa

Abstract: This article makes a contribution towards understanding the impact of temperature fluctuations on the economy and financial markets.  We present a long-run risks model with temperature related natural disasters.  The model simultaneously matches observed temperature and consumption growth dynamics, and key features of financial markets data.  We use this model to evaluate the role of temperature in determining asset prices, and to compute utility-based welfare costs as well as dollar costs of insuring against temperature fluctuations. We find that the temperature related utility-costs are about 0.78% of consumption, and the total dollar costs of completely insuring against temperature variation are 2.46% of world GDP.  If we allow for temperature-triggered natural disasters to impact growth, insuring against temperature variation raise to 5.47% of world GDP. We show that the same features, long-run risks and recursive-preferences, that account for the risk-free rate and the equity premium puzzles also imply that temperature-related economic costs are important.  Our model implies that a rise in global temperature lowers equity valuations and raises risk premiums.

Temperature, Aggregate Risk, and Expected Returns
Ravi Bansal, Marcelo Ochoa

Abstract: In this paper we show that temperature is an aggregate risk factor that adversely affects economic growth.  Our argument is based on evidence from global capital markets which shows that the covariance between country equity returns and temperature (i.e., temperature betas) contains sharp information about the cross-country risk premium; countries closer to the Equator carry a positive temperature risk premium which decreases as one moves farther away from the Equator.  The differences in temperature betas mirror exposures to aggregate growth rate risk, which we show is negatively impacted by temperature shocks.  That is, portfolios with larger exposure to risk from aggregate growth also have larger temperature betas; hence, a larger risk premium.  We further show that increases in global temperature have a negative impact on economic growth in countries closer to the Equator, while its impact is negligible in countries at high latitudes.  Consistent with this evidence, we show that there is a parallel between a country's distance to the Equator and the economy's dependence on climate sensitive sectors; in countries closer to the Equator industries with a high exposure to temperature are more prevalent.  We provide a Long-Run Risks based model that quantitatively accounts for cross-sectional differences in temperature betas, its link to expected returns, and the connection between aggregate growth and temperature risks.


More related material here.

9.21.2011

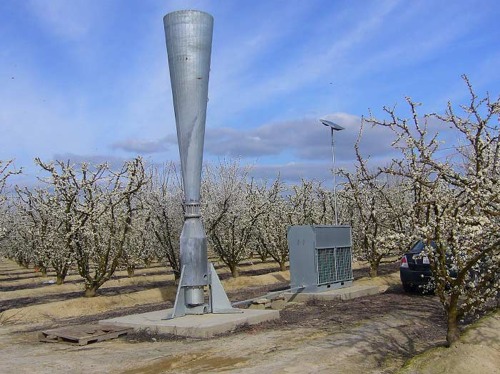
Hail cannons?

My sister just emailed me from France to tell me that all the vineyards they were visiting talked about weather modification via "hail cannon."  I had never heard of this and did a quick search to see what it was and if there's any evidence that the technology works.

hail cannons in 1901
modern hail cannon installation
(from boingboing)
Apparently, it's a 100 year old technology with [perfect] properties that make it impossible for individuals on the ground to evaluate whether it works or not.  The manufacturer's claim is that directed explosions on the ground can generate shock waves that interfere with hail stone formation.  More "support" for this claim is here, but the latest scientific paper cited is a theory paper from 1966 (be sure to check out this entertaining "explanatory" animation).

It doesn't seem like anyone has seriously tried to evaluate whether this approach works. In 1981, a review of the evidence suggested that our understanding had changed little between 1902 and 1975:

From: History Repeated: The Forgotten Hail Cannons of Europe
Stanley A. Changnon Jr. and J. Loreena Ivens (BAMS, 1981)

A more recent review contains additional interesting history:
[H]ail cannons are the best known apparatus to fight hail by force.  They direct the sound of an acetylene explosion, more than 120 dB, upward by way of a conical vertical muzzle. Originally these cannons were developed in 1896 by Albert Stiger, an Austrian winegrower.  When in Stiger's valley no hail had fallen for two  years, employing these cannons became an immense craze in Austria and in northern Italy.  A cannon industry  developed, and over ten thousand cannons were employed in the region around 1900.  At a hail conference in Lyon in 1901, many different makes of cannon were offered for sale (Fig.5).  However, when regularly locations with plenty of cannons were heavily damaged by hail, public confidence decreased and the authorities organized a systematic experiment  of several years in some Austrian and Italian regions.  By the time that this experiment was concluded in 1906, most farmers already had sold their useless cannons as scrap iron (PERNTER, 1907; ODDIE, 1965; CHANGNON and IVENS, 1981)
RCT anyone?

8.14.2011

Weather, stock market returns, and subtlety in causal inference

While hanging out with a few academic friends on Friday I began discussing a recent research paper with someone I didn't know particularly well. It turned out that this guy was the odd man out of the group and instead of being a professor / post doc / grad student he worked in finance, and was not terribly supportive of a lot of empirical work. Trotting out the classic "correlation doesn't imply causation" critique he then said something along the lines of "you could show that rain makes the stock market go up and down and it wouldn't mean anything." This of course reminded me of one of my favorite counterintuitive-but-compelling research literatures: the effects of weather on stock market returns.

Now, first off, it has to be said that one of the nice things about working with climate data and effects is that causality is, in fact, generally pretty easy to establish. While humans appear to be quite good at affecting climate at decadal time scales, we generally are unable to affect day-to-day or even month-to-month weather patterns, and have great difficulty predicting timing and spatial patterns of highly-relevant weather behavior such as heat waves and storms even over a time span of hours or days. While this is bad from a welfare point of view (e.g., we'd love to be able to predict where a hurricane will make landfall a month ahead of time) it means that statistical analyses of the impact of weather itself on a given phenomenon, provided you're careful about your research design, are generally pretty causally attributable. (see important caveat below)*

Given that, it turns out that there's some pretty strong evidence that weather affects stock market returns. There are multiple papers pointing out that stock market returns are affected by local weather (the latter of those containing this depressing gem of wisdom: "behavioral finance shows that lower temperature can lead to aggression, while higher temperature can lead to both apathy and aggression"). My favorite and, as far as I can tell from this literature, the definitive word on the subject so far, is this paper by Hirschleifer and Shumway showing that: yes, stock market returns are affected by the weather; the effect is driven by sunlight or the lack thereof and not precipitation per se; but the effects are so small that the only way to arbitrage across it is if you have absurdly low transaction costs (echoing one of my favorite applied finance papers of all time, Schleiffer's The Limits of Arbitrage).

If the sunlight result makes you think of SAD, or seasonal affective disorder, you're onto something interesting: Kamstra, Kramer and Levi find strong evidence (getting some nice identification off of solar insolation across hemispheres) that stock markets experience something like it, too. A follow up paper argues that one could capture the same result based just on hemisphere-appropriate seasonality and that an explicitly psychological 'SAD' effect is probably not supportable at present, though that finding was in turn disputed by Kamstra et al. Regardless, I'd argue that (a) seasonality driving markets is a fairly interesting idea, as is any result that links natural processes (which, after all, the seasons fundamentally are) and human behavior and (b) this only further impresses the necessity of the important caveat below.

All of which is to say that sometimes what seems at first glance to be a semi-ludicrous postulate can turn out to be quite true. Evidence has been found that stock markets are affected by everything from sports results to lunar phases, and in many cases these relationships seem both intuitive and robust. The question of what those results mean, however, can sometimes be difficult to tease out (have I mentioned the important caveat*?), so a policy proscription or a deeper insight into human nature might not actually be forthcoming. Put in other words, perhaps my finance friend was right: you can show that stock markets are affected by sunny days, but really, what does that mean?

* Important caveat: The fact that weather is exogenous doesn't mean that saying something about mechanisms / pathways / etc. is easy. Weather affects everything from crop production to labor supply to ecology and phenology to the stock market behaviors seen above, so if you're going to make a claim about weather affecting something *through* some pathway, or even more dangerously plan on using it as an instrument, you should be very, very careful. Economists call your justification for claiming causality in such cases your "exclusion restriction," and if there's one concept I'd like to see enter into the general population memosphere, it's that.

8.09.2011

Follow the Hurricane Season

Artemis has a nice site for following the Atlantic's current storm season here.  The site even tabulates predictions from the various forecasting groups and has links to real-time satellite imagery.

The site features a viewer by stormpulse.com, which is worth checking out on its native site for a variety of interactive features (they also map Pacific storms other severe weather in the United States).  This data-visualization group may even be helping our government improve short-term policy: they've made it onto an LCD in the White House situation room for three years running.

7.22.2011

Heat


If you're in the continental US this week you've no doubt experienced one of the worst heat waves in a while. It's hitting 100 (Fahrenheit, sorry) in New York today and the same air mass broke records across the country as it slid east. To that end, here are a few explanatory science links to get you through your needlessly hot Friday afternoon:

7.21.2011

The impact of piracy on general circulation models

Sometimes the interdisciplinary research grant proposals write themselves. From last week's EOS:
Pirate Attacks Affect Indian Ocean Climate Research
Pirate attacks in the Gulf of Aden and the Indian Ocean off the coast of Somalia nearly doubled from 111 in 2008 to 217 in 2009 [International Maritime Bureau, 2009, 2010]. Consequently, merchant vessel traffic in the area around Somalia significantly decreased. Many of these merchant vessels carry instruments that record wind and other weather conditions near the ocean surface, and alterations in ship tracks have resulted in a hole sized at about 2.5 million square kilometers in the marine weather–observing network off the coast of Somalia.
The data void exists in the formation region of the Somali low-level jet, a wind pattern that is one of the main drivers of the Indian summer monsoon. Further, a stable, multidecadal record has been interrupted, and consequently, long-term analyses of the jet derived from surface wind data are now showing artificial anomalies that will affect efforts by scientists to identify interannual to decadal variations in the climate of the northwestern Indian Ocean.
Link to abstract (full article is behind paywall). For more Fight Entropy posts on piracy click here. Note that this relationship has serious endogeneity issues.

6.28.2011

$20B/yr to air condition troops in Iraq and Afghanistan

When I've presented my work on thermal stress and economic productivity (also see herehere, here and here for related work) most people's first response is, "so... poor countries should use more air conditioning?" to which is say "Yes, but..." and then discuss the fact that air conditioning isn't exactly cheap if you have $1000/year to live on (so this investment may not always be worth it for poor individuals). To do this, I usually point out that and AC costs at least $100 to buy and $10/month (at least) in electricity costs.  But my casual back of the envelope estimates of operational costs might be way off.  I had been assuming that electricity and ACs could be obtained in a poor country for the same price I can get these goods in New York.  I was probably being too optimistic.

Listening to NPR today, I heard this report:
The amount the U.S. military spends annually on air conditioning in Iraq and Afghanistan: $20.2 billion. 
That's more than NASA's budget. It's more than BP has paid so far for damage during the Gulf oil spill. It's what the G-8 has pledged to help foster new democracies in Egypt and Tunisia. 
"When you consider the cost to deliver the fuel to some of the most isolated places in the world — escorting, command and control, medevac support — when you throw all that infrastructure in, we're talking over $20 billion," Steven Anderson tells weekends on All Things Considered guest host Rachel Martin. Anderson is a retired brigadier general who served as Gen. David Patreaus' chief logistician in Iraq. 
Why does it cost so much? 
To power an air conditioner at a remote outpost in land-locked Afghanistan, a gallon of fuel has to be shipped into Karachi, Pakistan, then driven 800 miles over 18 days to Afghanistan on roads that are sometimes little more than "improved goat trails," Anderson says. "And you've got risks that are associated with moving the fuel almost every mile of the way." 
Anderson calculates more than 1,000 troops have died in fuel convoys, which remain prime targets for attack. Free-standing tents equipped with air conditioners in 125 degree heat require a lot of fuel. Anderson says by making those structures more efficient, the military could save lives and dollars.
This suggests the annual price of AC for each of our 70,000 troops is $31,428.57 per soldier, two orders of magnitude over my ~$200 back of the envelope estimate. I'm certain that this price is not the actual consumer price that we would observe for air conditioners being used by residents in the long-run, but it's so much larger than my previous estimate that I may have to reconsider how effective I think AC expansion is for mitigating the economic impact of high temperatures.

6.11.2011

Trends in weather deaths

Jesse pointed me to this opinion piece in the WSJ about weather related deaths in the US, thinking I should comment on it.  I have lots of comments on it, but I'm saving several of them for a paper I'm working on with Daiju Narita (stay tuned...).  But in the meantime, interested folks can see this recent article (by Betsy Wiesendanger at Columbia B-School's magazine Chazen Global Insights) about my related work with Daiju.

5.25.2011

TRMM Satellite picks up Joplin tornado


Our colleague and occasional guest poster Kyle Meng points out that NASA's TRMM satellite (previously here) passed over the supercell that generated this past weekend's megatornado in Joplin, MO, generating a map of the resultant precipitation. You can find out about it here.