Showing posts with label HSES. Show all posts

8.03.2011

The causal effect of going to my high school

An old high school friend* (crony?) sent me a Gothamist article linking to a new NBER paper by Abdulkadiroglu, Angrist, and Pathak on the causal effect of going to a New York City or Boston specialized public high school:
[...] We estimate the causal effect of exam school attendance using a regression-discontinuity design, reporting both parametric and non-parametric estimates. We also develop a procedure that addresses the potential for confounding in regression-discontinuity designs with multiple, closely-spaced admissions cutoffs. The outcomes studied here include scores on state standardized achievement tests, PSAT and SAT participation and scores, and AP scores. Our estimates show little effect of exam school offers on most students' achievement in most grades. We use two-stage least squares to convert reduced form estimates of the effects of exam school offers into estimates of peer and tracking effects, arguing that these appear to be unimportant in this context. On the other hand, a Boston exam school education seems to have a modest effect on high school English scores for minority applicants. A small group of 9th grade applicants also appears to do better on SAT Reasoning. These localized gains notwithstanding, the intense competition for exam school seats does not appear to be justified by improved learning for a broad set of students.
For the non-economists on this blog, Josh Angrist is one of the top empirical economists in the world (as well as enormously fun to read, viz my beach reading from last spring break) so having him evaluate your high school's academic outcomes is sort of like having John Madden come in and critique your JV football team.

As the authors openly admit in the paper, the experimental design (regression discontinuity, which was begging to be used to evaluate NYC specialized high school outcomes) is inherently limited in what it can say about students who were not near the cutoff. By assumption one treats students who barely make it into the school as being more or less the same as students who barely fail to make it in, and thus "going to the specialized high school" can be considered quasi-randomly assigned. Given that (and all of the tests that are run to make sure this assumption is valid) it looks like the simple act of going to a specialized high school when you're on the cusp is pretty nil. This may be surprising (and of course gets summarized in the Gothamist as "Stuyvesant, Bronx Science, Top Public Schools Not Worth It") but I think becomes less so with a little unpacking...

First, it's important to note that there's a very big difference between being in the bottom 10% at one school versus the top 10% at another. Kids who barely make it into a specialized high school are competing and comparing themselves against the remaining 90% of students who had little difficulty getting in. Meanwhile, their comparables at other schools are at the high end of the distribution. Given the complex nature of peer effects, teacher attention, and everything else, I'd say that these populations end up having very different experiences.

Second, I'd argue that a major reason specialized schools exist is not to help marginal kids do better but to allow superstar kids to do extraordinarily well. Stuy is famously referred to as a "haven for nerds" and like many top schools succeeds by virtue of giving driven and talented kids the opportunity and resources to do what they want. I imagine it'd be difficult to tease out (perhaps something geographic? I know a lot of kids from my neighborhood in the Bronx who went to Bronx Science despite getting into Stuy because it was much closer...) but I strongly suspect that the causal effect of going to the school is hugely nonlinear in ability.

Lastly, I'd say that even if we were to grant that the local treatment effect identified in the RD design reasonably proxied for the school's impact, test scores might not be the best place to look at outcomes. The specialized high schools are often touted as a means of leveling the playing field between poor (often immigrant) public school kids and rich private school ones. I suspect that if the outcomes of interest were not test scores but rather admission to elite colleges or wages in one's mid-20s, the results would be rather different.

In sum, the paper is super tightly identified, but given the populations they can plausibly claim to compare and the outcomes evaluated I'm not hugely surprised that the authors find little effect. My friends on Facebook and G+ who've been forwarding this to me can calm down. Unless they scored within 10% or so of the cutoff, in which case: sorry, guys, it was all for nothing...

* Full disclosure: I went to one of these schools (Stuyvesant) and *barely* made the cutoff, an experience that scared me into overperforming on standardized tests for the rest of my life.

5.26.2011

Google Correlate


Google Correlate goes live at Google Labs today. It provides correlative search by time or US state and returns the top most-correlated search terms and / or data series. For particularly Fight Entropy-ish content, check out terms that correlate with:
Also: their explanatory webcomic manages the rare feat of being simultaneously cute and informative.

5.24.2011

WeatherSpark


WeatherSpark combines two of our favorite topics (data visualization and climate/weather) in one very compelling package. A few quick and interesting things to do with it in under 5 minutes:
  1. Check out predicted cyclicality of temperatures over the 24 hour cycle
  2. Note the difference between observed weather (black line in the past) versus predicted
  3. Check out weather at different physical locations (close to / far from coast; east of / west of mountains; north / south; etc.)
  4. Play around with the other, less intuitive variables (pressure, humidity...)
  5. Do 1. 2. and 3. together to detect rural vs. urban heat island effects (particularly cool)
Enjoy!

4.20.2011

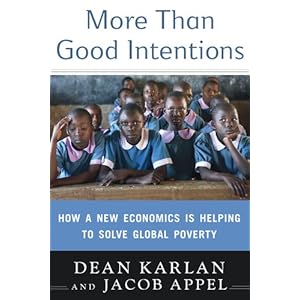
Karlan and Appel's "More Than Good Intentions"


Dean Karlan and Jacob Appel's new book More Than Good Intentions (previously mentioned here) is coming out tomorrow and Sol and I got a hold of review copies. To that end, a review:

Overall it's a great read. Karlan does behavioral development economics with a big emphasis on Poverty Action Lab-style randomized control trials, and the book is essentially a thematicized overview of the current state of that field. What's particularly worth noting is that behavioral development econ is very new: most of the papers and studies covered are from the last ten years (Googling around a bit turns up what I think is the earliest lit review from 2006), and as far as I can tell this is the first book on the subject at all.

That newness shows up in the general slant of the book. A lot of general-audience econ and science books tend towards pithy summaries of major results from the author's area of research (e.g., "libertarian paternalism works" or "clever identification can reveal crazy facts"). But the pithy summary of this book would probably be something like "psychology really affects economic outcomes in developing contexts, sometimes hugely, and here's some promising early evidence." There's less a grand thesis that's being hammered away at so much as a constellation of interesting data points all hinting at a new and interesting way to think about the fundamental problems of development.

Some of those seem very promising. The multiple sections on microfinance provide a lot of worthwhile food for thought, and Karlan & Appel's emphasis on the importance of providing microsavings as opposed to simply microcredit is particularly welcome. Other parts of the book on areas like agriculture, health, etc. seem to me almost as if they should be "behavioral" chapters in books on those subjects, which really is another way of saying that the field is young and there's a lot of research waiting to be done.

In short, the book was fun, engaging, and a quick read, and in combination with some background texts could probably could sub out for a nice undergrad class on behavioral development economics. I'd especially recommend it to high school and college students who are interested in development and trying to get oriented in the field / find out who the major players are / figure out which open problems are juiciest.

4.11.2011

ARV recovery video

Sol and I are both reading Dean Karlan and Jacob Appel's new book More Than Good Intentions these days. It's on behavioral solutions to development problems, it covers a good deal of very current applied development economics, and we'll be throwing a review up on the blog shortly (thus far I've enjoyed it enormously).

In the meantime, though, I thought I'd link to what I think is a stellar example of just such a behavioral solution to a development problem, namely, this ad for anti-retroviral AIDS drugs:


How is that behavioral? Well, I think it's one thing to hear about the remarkable reversal of decline that ARVs bring about in otherwise-terminal AIDS patients. It's another thing to see it and identify with it. That may seem obvious, but Karlan and Appel's book is one of the first to discuss marketing in the context of development solutions. I think that's a lovely way, to piggyback on Sol's earlier post, to benchmark just how far development economics still has to go.

4.07.2011

Quick Hit: "The Long Island Express"


Since I mentioned it during my talk with the HSES students on Tuesday, I figured I'd very quickly point out one of the more interesting climatic disasters in New York City history: the 1938 "Long Island Express" hurricane. From the very lovely history site New York Traveler comes this excerpt from an account by 18-year-old Arthur D. Raynor of Westhampton:
If you had already been advised that Long Island was close to perfection on earth, that we had no worries about floods, earthquakes, hurricanes or other natural disasters that had befallen other unfortunate parts of the earth, the chances are pretty good that you could have gotten fooled on the 21st day of September, 1938.
Only a few months before, the local theater had shown a saga called “Typhoon,” and among the things I had gotten out of that was an observation by one of the characters in the movie that “the birds were acting peculiarly.” They were portrayed (how do you get a flock of wild birds to act?) as being excited, nervous, anxious and so forth. Not being an avid bird watcher, I couldn’t really tell if our birds were doing the same thing that day around lunch time, but it was close enough for me to mention it to my Grandmother, and her Mother, a visitor at the time. And you could have bet money on the reply. “One thing you never have to worry about on Long Island is floods, hurricanes, earthquakes and all those other things everybody not smart enough to live here worry about.”
The hurricane was a Category 3 on the Saffir-Simpson scale when it made landfall (after peaking at Cat 5 out to sea) and devastated much of eastern Long Island and the south New England coast. Wind damage in New York City wasn't extreme but flooding was (viz the photo above). Of course, this wasn't the only major hurricane to hit New York City; the 1893 Hog Island Hurricane, for example, is so named because it washed away most of Hog Island in between Long Island and Long Beach.

More generally, this is a tidy, local, little example of one of the fundamental problems with disasters, namely that we often generalize about dangerous events over a period of time (e.g., the lifespan of a high school student) much shorter than the average amount of time between those events. New York City seems from casual remembrance to be at no serious risk from hurricanes, but looking at past history indicates that we will surely get hit by a big one sometime sooner or later. And it's certainly better to accept that risk and prepare for it than otherwise.

Some more resources on the LIE Hurricane can be found here, and PBS actually has a documentary about it here.

4.02.2011

What have we learned about oil prices? Not much.

[This is a guest post by Kyle Meng]

With recent rumblings of political unrest in the Middle East, concern about rising oil prices have returned to the headlines. None of this is new of course. 2005, our last episode of high oil prices, was only a few years ago. And of course, high oil prices triggered by political instability in the Middle East echoes the OPEC embargo of 1973 and the Iranian revolution of 1979. Even President Obama's recent call for energy independence appears like a deja-vu of Nixon's Project Independence in 1974. 

And as with before, many are wondering where oil prices are heading. Will it stay above $100 per barrel? Will we see some respite on the horizon? Unfortunately, it appears that our ability to answer these questions has also changed little over the last 30 years. Put simply, we just don't know. 


I recently came across this figure, assembled a few years back by Bill Hudson for a congressional testimony. The figure plots oil price forecasts made by the US Department of Energy made every year since 1982. Also shown is the actual spot price of oil. This analysis, presented each year in the DOE’s Annual Energy Outlook forecasts oil prices over the next 10-20 years. 

There are a few observations that jump out immediately. First, we’re really bad at making oil price forecasts in the long term (>5 years). For shorter horizons, our forecasts improve but only during periods of relative stable price movements (say the cheap oil price era of the late 1980s and 1990s). For periods of large swings, notably the early 1980s and mid 2000s, we seem to get everything wrong, regardless of time horizon. Interesting also are how the forecast biases change over time. Longer term forecasts in the 1980s and early 1990s seem to regularly overshoot the future price of all – all forecasts beyond 5 years seem to project that oil prices will increase, almost exponentially, into the horizon. This bias, perhaps a vestige of the 1970s oil shocks, diminishes overtime as forecasts “learn” to be less pessimistic, downplaying projected increases in future oil prices to the point that when the 2005 price spike occurs, the models are now too optimistic. In other words, we’re learning, but only to be told how wrong we are the next time a major event occurs. 

All this is interesting because forecasting is a regular part of the world we live in.  When an event occurs, we’re naturally inclined to wonder what will happen next. But that analysis is often difficult, particularly for systems as complex as global oil markets. Short run forecasts could always be made via a simple extrapolation of recent events but extrapolations do poorly against extreme events, which are the ones we typically care about anyways. As for the evens that do matter, unfortunately, we simply don’t have enough data to make good predictions, and so, time and time again, we’re taken by surprise.   

PhD. Student
School of International and Public Affairs
Columbia University

3.31.2011

Two epic data contests

Two major and exciting data analysis contests were announced (relatively) recently and I thought I'd point our visitors to them:
  • The citations and papers megadatabase Mendeley has announced The Mendeley API Binary Battle, ending on August 31st of this year. The competition is open-form and basically just seeks to find someone who'll create an interesting and popular app that does something to "make science more open." Entries are judged (by, among other people, Tim O'Reilly and the CTOs of Amazon and Thomson-Reuters) on a combination of usage statistics, "viralness", "making science more open", and "coolness." The prize is $10,001, though I should point out that the runner up gets a Quadricopter.
  • The Heritage Health Prize launches April 4th and seeks to "develop a breakthrough algorithm that uses available patient data, including health records and claims data, to predict and prevent unnecessary hospitalizations." The contest uses high-quality anonymized actual patient data and is expected to run for about two years. The prize is $3 million.
The Netflix Prize is probably the most famous example of a data analysis competition, and apparently resulted in a rather large increase in the efficacy of Netflix's movie preference prediction algorithms. IBM Systems Magazine's blog has a rundown of data prizes in general here.

Personal accounts of climate-related conflict

MediaStorm produced for this nice video story for Yale's Environment 360 (there is a written discussion here as well).

For people like me who study climate-induced conflict with statistics and mathematical models, it's important to stay in touch with these personal stories of the people who suffer through these events.


As temperatures rise and water supplies dry up, semi-nomadic tribes along the Kenyan-Ethiopian border increasingly are coming into conflict with each other. When the Water Ends focuses on how worsening drought will pit groups and nations against one another. See the project at http://mediastorm.com/clients/when-the-water-ends-for-yale360

3.27.2011

Supplying Africa with climate data to fight disease

Climatic suitability for
malaria transmission.
See more here
In a Comment to Nature this week, M.C. Thomson et al. make the case that climatological information in Africa is under-supplied to decision-makers, especially in the management of public-health (read it here). They suggest that adequate climate information is in short supply because it is a public good, and the value it will generates is through the improvement of other public goods (such as sanitation).

"Climate information is not readily available, so is rarely incorporated into development decisions. At the same time, few public-health institutions or practitioners are equipped to understand or manage the effects of a changing climate, despite major advances in recent years in alerting the health community to its risks.
A dramatic improvement is needed in the availability of relevant and reliable climate data and services, particularly in Africa, where vulnerability to climate is so high. Information — such as historical observations of temperature, ten-day satellite estimates of rainfall, the predicted start date of the rainy season or the likelihood of extreme temperatures in the coming season — should inform the management of all diseases sensitive to climate. These include: malaria, leishmaniasis, acute respiratory infections, intestinal helminths and diarrhoeal diseases. This information could also contribute to food security by providing, for example, early warning for agricultural and livestock pests and diseases.
The following must be put in place within the next decade: new partnerships between the public-health community and national meteorological agencies, space agencies and researchers; a governance structure that ensures data sharing between public and private agencies; a funding model that builds open-access climate databases; climate scientists focused on the delivery of quality products, tailored to user needs; health professionals trained to demand and use climate information; and evidence of the value of all this, relative to alternative investments in health."
The authors use the example of Kericho, Kenya to make their point clear:
(Blue shading is the number of malaria cases per month)
SOURCES: REF. 7; G. D. SHANKS ET AL. GO.NATURE.COM/CPN7KD


"That it took a decade to establish a robust analysis of climate trends in Kericho, a focus of so much controversy, points to a broader disconnect between those who need climate information and those who produce it. In the 1980s, African meteorological agencies were encouraged to sell their data to raise revenue to maintain their networks of meteorological stations. The agencies' services have understandably prioritized their primary client, the airline industry. Access for non-commercial purposes, including for malaria research, has been constrained by poor collaboration and high data fees, among other factors. 
Instead, funding models are needed that recognize climate data as a resource for development — a classic public good that increases in value the more times the data are used." 

3.16.2011

Social Conflict in Africa Database

The University of Texas at Austin has put together a new dataset to support conflict research in Africa. Some nice features of this dataset are that they code many types of conflict, not just civil wars, and that the conflicts have "issues" associated with them (eg. "democracy" or "environmental degradation"). The database is searchable and downloadable, and the website has some nice discussions of ongoing research projects.
The Social Conflict in Africa Database (SCAD) is designed to provide users with a comprehensive, methodologically rigorous resource for analyzing social conflict events across the African continent, including all countries with a population of more than 1 million.  It compiles events reported by the Associated Press and Agence France Presse from 1990-2009.  SCAD is designed for use by academic researchers, as well as by journalists, non-governmental organizations, policy makers, and others interested in African politics.

Each record in SCAD refers to a unique social conflict event.  To define an event, the researchers determined the principal actor(s) involved, the target(s), as well as the issues at stake.  Events can last a single day or several months.  A conflict is coded as a single event if the actors, targets, and issues are the same and if there is a distinct, continuous series of actions over time.
Some interesting plots from the website:


3.14.2011

Welcome High School for Environmental Studies students!

Greetings and welcome to students from the High School for Environmental Studies!

Sol and I have gotten wind that you're going to be our online guests leading up to our talk on April 5th. We're very happy to have you guys here and hope you're as excited as we are. We've set up this page up so you have an easy and accessible place to find out more about climate change, sustainable development, and our research. In particular you might want to check out any post tagged with the HSES tag, since those are going to be oriented more specifically towards you. Please feel free to check back every now and then for new content and links, and if you have any questions don't hesitate to email either of us (Jesse: jka2110@columbia.edu Sol: smh2137@columbia.edu).

Assorted reference links:
Previous posts on the blog that you might like:
General advice on getting ready for college, research, environmentalism, etc.: